Download Data handling Worksheet for Class 4

Q.1) The following pictograph shows the number of pet animals sold in a month –
Each symbol = 5 pets
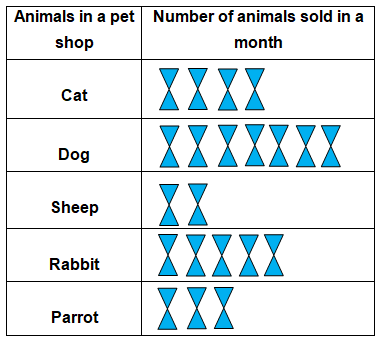
i) Which pet was sold the most ?
a) Parrot
b) Rabbit
c) Dog
ii) How many more Cats were sold as compared to Sheep ?
a) 25
b) 10
c) 20
iii) How many Dogs were sold in a month ?
a) 35
b) 55
c) 30
iv) How many Parrots were sold in a month?
a) 16
b) 15
c) 10
v) Which pet was sold the least ?
a) Dog
b) Cat
c) Sheep
Q.2) Given below is a bar graph showing the number of A.C sold in 5 months –
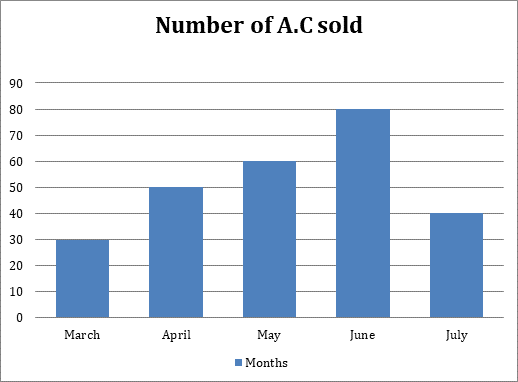
i) How many A.C were sold in the month of May ?
a) 60
b) 40
c) 30
ii) How many A.C were sold in the month of April ?
a) 70
b) 40
c) 50
iii) In which month minimum number of A.C were sold ?
a) April
b) March
c) June
iv) In which month maximum number of A.C were sold ?
a) June
b) May
c) July
v) How many more A.C were sold in the month June than in July?
a) 60
b) 30
c) 40
Data handling Worksheet for Class 4 Explanation
Q.1) Explanation – Data handling Worksheet for Class 4
i) Since there are maximum number of symbols for Dog, Dog is sold the most in a month.
Correct Answer – c) Dog
ii) Given that each symbol = 5 pets
So, the number of Catssold = ( 5 x 4 ) = 20
The number of Sheep sold = ( 5 x 2 ) = 10
Number of Cats sold more as compared to Sheep = The number of Cats sold – The number of Sheep sold
= 20 – 10 = 10
Correct Answer – b) 10
iii) Given that each symbol = 5 pets
So, the number of Dogs sold =( 5 x 7 )
= 35
Correct Answer – a) 35
iv) Given that each symbol = 5 pets
So, the number of Parrots sold = (5 x 3) = 15
Correct Answer – b) 15
v) Since there are minimum numbers of symbols for sheep, therefore Sheep were sold the least.
Correct Answer – c) Sheep
Q.2) Explanation – Data handling Worksheet for Class 4
i) From the given bar graph
Number of A.C sold in the month of May = 60
Correct Answer – a) 60
ii) From the given bar graph
Number of A.C sold in the month of April = 50
Correct Answer – c) 50
iii) From the given bar graph
Number of A.C sold in the month of March = 30
Number of A.C sold in the month of April = 50
Number of A.C sold in the month of May = 60
Number of A.C sold in the month of June = 80
Number of A.C sold in the month of July = 40
Therefore, minimum number of A.C sold in the month of March.
Correct Answer – b) March
iv) From the given bar graph
Number of A.C sold in the month of March = 30
Number of A.C sold in the month of April = 50
Number of A.C sold in the month of May = 60
Number of A.C sold in the month of June = 80
Number of A.C sold in the month of July = 40
Therefore, maximum number of A.C sold in the month of June.
Correct Answer – a) June
v) From the given bar graph
Number of A.C sold in the month of June = 80
Number of A.C sold in the month of July = 40
Difference of sell of A.C in the month of June and July = 80 – 40 = 40
Therefore, 40 more A.C were sold in the month of June than in July.
Correct Answer – c) 40
Maths Worksheets for Class 4
- Addition Worksheets for Grade 4
- Subtraction Worksheets for Grade 4
- Multiplication Worksheets Grade 4
- Division Maths Worksheets Grade 4
- Fractions Worksheets Grade 4
- Factors and Multiples Worksheet Grade 4
- Unitary Method Worksheet Grade 4
- Metric Measures Worksheets for Class 4
- Time Worksheets Grade 4
- Money Worksheets Grade 4
- Data handling Worksheet for Class 4
8 thoughts on “Data handling Worksheet for Class 4”
Very NIce
very nice
it was really helpful to improve my data handling skills thanks!
Very nice.
Explanation was nice
Very Very Very Good
very nice concept to learn the data handling thanks to the website for a very natural concept exellent
Really interesting post!