The objects around us move in various ways. We can observe their motion in our day to day lives but the proper analysis of their motion using various concepts of physics require that we explain the movements in the form of mathematical equations or graphs. Graphical representation of motion is the easiest way to represent any motion happening around us and can be easily interpreted.
The two main types of graphs used in the world of physics for representing motion are – distance time graph and velocity time graph. The terms velocity and speed are used in the same sense while plotting graphs though they are different in meaning. This is done to ensure uniformity as in some places you will find the terms speed and velocity being used interchangeably.
It is to be noted that whenever we plot a distance time graph or velocity time graph, time is always taken along x-axis whereas distance or speed / velocity is taken along y-axis.
Distance time graph
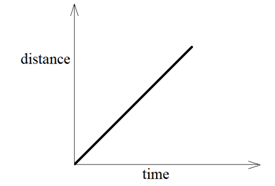
Distance-time graphs are plotted keeping distance along y-axis and time along x-axis. These graphs give an idea about the distance travelled by the body with respect to time. These graphs can give a lot of information about the type of motion of a body.
When a body performs uniform motion, it travels equal distances in equal intervals of time. In other words, the distance travelled is directly proportional to time. Thus, for uniform motion the distance-time graph of a body will be straight line.
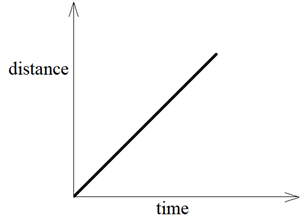
We can also observe that if the motion of a body is represented by a straight line on distance-time graph, it is performing uniform motion in that time interval.
The slope of distance-time graph gives the speed of the object. To find the speed of the body from distance – time graph we take any point A on the straight line and drop a perpendicular from A on x-axis, name it B and drop a perpendicular on y-axis, name it C. The distance travelled by the body is represented by AB and the time interval is represented by OB.
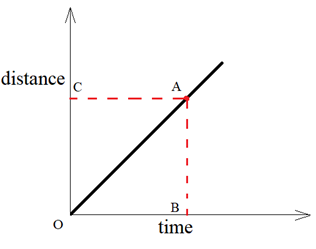
We know that :
Speed = Distance travelled/Time taken
Speed = AB/OB
AB/OB is known as slope (or gradient) of the graph line OA.
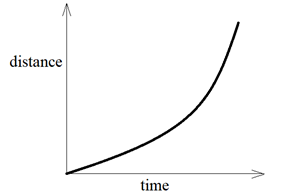
The motion of a body can also be non – uniform which means that the body covers unequal distances in equal intervals of time. Such a motion is represented by a curve on distance time graph.
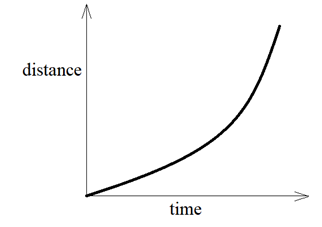
Hence, we can categorise the motion of a body by looking at the distance – time graphs of their motion. If it is a straight line then the body is performing uniform motion otherwise if it is curved line then the body is performing non – uniform motion.
If instead displacement – time graphs are drawn, their slopes will give the velocity of object whose graph is plotted.
Velocity time graph (or Speed time graph) – Graphical Representation of Motion
As discussed earlier, we have considered speed-time graph and velocity-time graph to be one and the same thing.
There are three types of velocity – time graphs. These are :-
(i) When the speed of the body remains constant (and there is no acceleration)
(ii) When the speed of the body changes at a uniform rate (there is uniform acceleration)
(iii) When the speed of the body changes in a non – uniform way (there is non – uniform acceleration)
Velocity time graph when the speed remains constant – Graphical Representation of Motion
When we say that the speed of the body remains constant, we mean to say that the speed of the body is not changing with respect with time and hence, there is no acceleration. So, the velocity – graph of a body moving with constant speed is a straight line parallel to the x – axis (time axis).
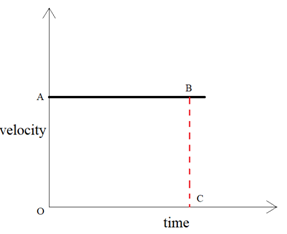
The acceleration of a body moving with constant speed is zero. But we can find the distance covered by the body from its velocity – time graph.
We know that:
Speed = Distance travelled/Time taken
So, Distance travelled = Speed x Time taken
To find the distance covered by the body at point C, we draw a perpendicular CB at point C which meets the straight line graph at point B.
Now, speed at C = CB
But, CB = OA
Thus, speed at C = OA
And, time at C = OC
Substituting these values in the above formula, we get
Distance travelled = OA x OC
Distance travelled = Area of rectangle OABC
Thus, the area enclosed by the velocity – time graph gives the distance travelled by the body.
Velocity – time graph when speed changes at a uniform rate (uniform acceleration) – Graphical Representation of Motion
When a body moves with uniform acceleration, its speed changes by equal amounts in equal intervals of time. in other words, we can say that the speed of the body is directly proportional to time. Thus, the velocity – time graph of a body moving with uniform acceleration is a straight line.
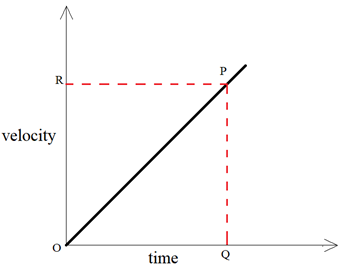
We can find out the value of acceleration of a body from its velocity – time graph. To calculate the acceleration at a time corresponding to point Q , we draw a perpendicular QP from point Q which touches the straight line graph at point P. We know that,
Acceleration = Change in speed (or velocity)/ Time taken
The change in speed is represented by PQ whereas time taken is equal to OQ.
So, Acceleration = PQ/OQ
But PQ/OQ is the slope or gradient of the speed – time graph OP, therefore, we conclude that in a speed time graph, the acceleration is given by the slope of the graph. In other words, the slope of a velocity – time graph of a moving body gives its acceleration.
The distance travelled by a moving body in a given time can also be calculated from its velocity – time graph.
Distance travelled = Area of ΔOPQ
= 1/2 x area of rectangle ORPQ
= 1/2 x OR x OQ
In a velocity – time graph of a body, a straight line sloping upwards shows uniform acceleration. In a velocity – time graph of a body, a straight line sloping downwards indicates uniform retardation.
Velocity-time graph when speed changes at a non – uniform rate – Graphical Representation of Motion
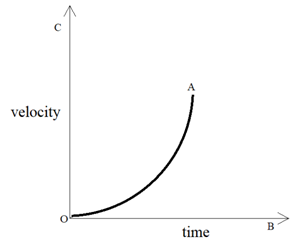
When the speed of the body changes in an irregular manner, then the speed – time graph of the body is a curved line.
The distance travelled by the body is given by the area enclosed by the velocity-time graph and the slope of graph gives the acceleration.
Questions related to the Graphical Representation of Motion Class 9 NCERT Textbook – Page 107
Question 1:-
What is the nature of the distance-time graphs for uniform and non-uniform motion of an object?
Answer:-
The distance-time graph for an object having uniform is a straight line with some slope.
The distance-time graph of an object having non-uniform motion is a curved line.
Question 2:-
What can you say about the motion of an object whose distance-time graph is a straight line parallel to the time-axis?
Answer:-
If the distance-time graph is a straight line parallel to the time-axis, it represents that the distance travelled by the object is neither increasing nor decreasing with time. hence, the object is stationary.
Question 3:-
What can you say about the motion of an object if its speed-time graph is a straight line parallel to the time-axis?
Answer:-
If the speed-time graph is a straight line parallel to time-axis then we can observe that the speed of the object is not changing with time. hence, the object is moving with constant speed and zero acceleration.
Question 4:-
What is the quantity which is measured by the area occupied below the velocity-time graph?
Answer:-
The area under velocity-time graph gives distance travelled.
Conclusion –
The graphical representation of motion is easy to interpret and helps in determining velocity, distance travelled, acceleration of a body. The distance-time graph is a straight line for uniformly moving bodies and is a curved line for non-uniformly moving bodies. The slope of distance-time graph gives the speed of body. The velocity-time graph is a straight line parallel to time axis for body moving with constant speed, straight line inclined to time axis for bodies moving with uniform acceleration and curved line for bodies moving with non-uniform acceleration. The area under velocity-time graph gives distance and the slope gives acceleration.