There are three equations of motion that can be used to find unknown quantities involved in the motion of object. These equations are only for uniformly accelerated motion. The graphical representation of equations of motion involves plotting the motion on a velocity-time graph and then using simple mathematics and geometry to graphically derive these equations.
Consider this velocity-time graph of a body moving with uniform acceleration.
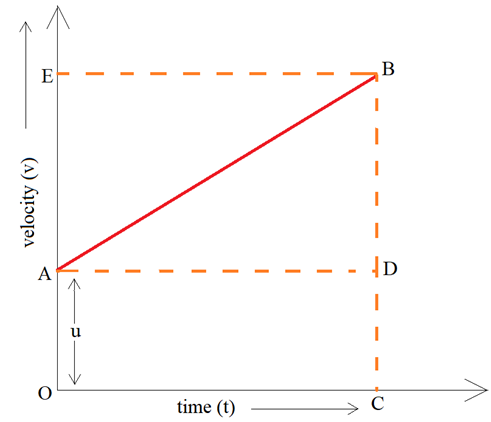
The body has an initial velocity of ‘u’ at point A and then its velocity changes at a uniform rate from A to B in time ‘t’. In other words, there is a uniform acceleration from A to B, and after time ‘t’ its final velocity becomes ‘v’ which is equal to BC in the graph. The time ‘t’ is represented by OC. To complete the graph, a perpendicular CB is drawn from point C and a perpendicular AD is drawn parallel to OC. BE is the perpendicular from point B to OE.
We will try to derive the three equations of motion one by one.
Let’s start with first equation of motion.
Derivation of first equation of motion by graphical method –
The first equation of motion is : v = u + at
Given:
Initial velocity of the body (u) = OA
Final velocity of the body (v) = BC
From the graph BC = BD + DC
Therefore, v = BD + DC
Again, DC = OA
So, v = BD + OA
Now, since u = OA
So, v = BD + u
We know that the slope of velocity-time graph is equal to acceleration ‘a’.
Acceleration, a = slope of line AB
a = BD/AD
But AD = OC = t
Substituting t in place of AD in the above relation, we get :
a = BD/t
BD = at
Now, putting this value of BD in equation, we get:
v = at + u
This equation can be rearranged to give:
v = u + at
Hence, we have derived the first equation of motion by graphical representation.
Derivation of second equation of motion by graphical method –
The second equation of motion is: s = ut + (1/2)at²
Let us assume that the distance travelled by the body is ‘s’ in time ‘t’. The distance travelled by the body can be calculated by calculating the area under the velocity-time graph.
The area under the graph is equal to the area of OABC. Thus,
Distance travelled = area of figure OABC
= area of rectangle OADC + area of triangle ABD
Area of rectangle OADC = OA ×OC
= u × t
= ut
Area of triangle ABD = (1/2) × area of rectangle AEBD
= (1/2) × AD × BD
= (1/2) × t × at
= (1/2)at²
So, distance travelled (s) = area of rectangle OADC + area of triangle ABD
s = ut + (1/2)at²
Hence, we have derived the second equation of motion by graphical representation.
Derivation of third equation of motion by graphical method –
The third equation of motion is : v² = u² + 2as
We know that the area under velocity-time graph gives us the distance travelled by the body.
So, let us assume that the distance travelled by the body is and to cover this distance the time taken by the body is .
The area required to calculate is that of trapezium OABC.
Therefore, distance travelled = area of trapezium OABC
s = [(sum of parallel sides) × height]/2
s = [(OA + BC) × OC]/2
Now, OA + CB = u + v and OC = t.
Substituting these values in above relation, we get –
s = [(u + v) × t]/2
Now, we have to eliminate ‘t’ from the above equation. This can be done by substituting the value of ‘t’ from first equation of motion.
v = u + at
v – u = at
t = (v – u)/a
Substituting this value in above equation, we get –
s = [(v+u)(v-u)]/2a
2as = (v+u)(v-u)
2as = v² – u²
v² = u²+ 2as
Hence, we have proved third equation of motion by graphical representation.
The graphical representation of motion is done either through distance-time graphs or velocity-time graphs. The velocity-time graph for uniformly accelerated body can be used to derive the three equations of motions. The graphical representation of equations of motion is a approach to reach at the three equations using geometrical and mathematical concepts. We know that slope of velocity-time gives us the acceleration and the area under the graph gives the distance travelled. These concepts are used to derive the three equations and reach at the result.