Data handling Class 8 MCQ Questions with Answers Maths are covered in this Article. Data handling Class 8 MCQs Test contains 12 questions. Answers to MCQs on Data handling Class 8 Maths are available at the end of the last question. These MCQ have been made for Class 8 students to help check the concept you have learnt from detailed classroom sessions and application of your knowledge. For more MCQ’s, subscribe to our email list.
| Board | CBSE |
| Textbook | Maths (NCERT) |
| Class | Class 8 |
| Chapter | Chapter 5 Data handling |
Data handling Class 8 MCQ Questions with Answers
1.Given below are the marks in English obtained by 8 students of a class . 63, 34, 52, 81, 46, 32, 67, 78 Find the lowest marks , highest marks and the range of the given data ?
(a) Lowest marks = 42 , Highest marks = 71 , Range = 39
(b) Lowest marks = 32 , Highest marks = 81 , Range = 49
(c) Lowest marks = 37 , Highest marks = 76 , Range = 34
Answer
Answer: (b) Lowest marks = 32 , Highest marks = 81 , Range = 49
Explanation: Arranging the above data in Ascending order,
32, 34, 46, 52, 63, 67, 78, 81
We know that range is the difference between the highest and lowest value of the observations in a data
From the above data,
Lowest marks = 32
Highest marks = 81
Range of the given data = 81 – 32
= 49
2.A dice was thrown and the following outcomes were noted : 4, 3, 1, 4, 3, 1, 5, 4, 5, 6, 1, 5, 6, 1, 5, 6, 4, 6, 5, 6, 5 Prepare a frequency distribution table of the data.
(a)
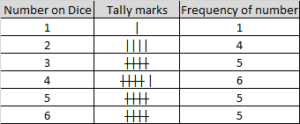
(b)
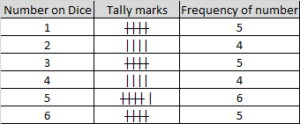
(c)
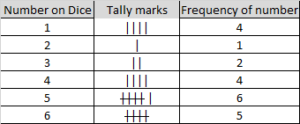
Answer
Answer: (c)
Explanation: Arranging the data in Ascending order,
1, 1, 1, 1, 2, 3, 3, 4, 4, 4, 4, 5, 5, 5, 5, 5, 5, 6, 6, 6, 6
We find that,
1 occurs 4 times;
2 occurs 1 times;
3 occurs 2 times;
4 occurs 4 times;
5 occurs 6 times;
6 occurs 5 times;
Thus, the frequency distribution table of the above data may be presented as given below
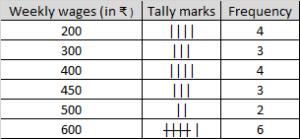
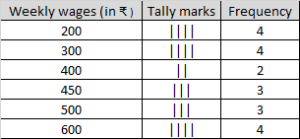
3.The weekly wages (in rupees) of 22 workers of a factory are given below : 200, 400, 600, 500, 300, 450, 600, 400, 300, 200, 600, 450, 200, 400, 200, 600, 400, 600, 450, 500, 600, 300 Prepare a frequency distribution table of the data
(a)
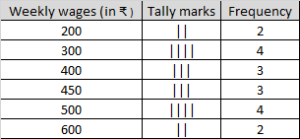
(b)
(c)
Answer
Answer: (B)
Explanation: Arranging the data in ascending order,
200 , 200 , 200 , 200 , 300 , 300 , 300 , 400 , 400, 400 , 400 , 450 , 450 , 450 , 500 , 500 , 600 , 600
We find that,
200 occurs 4 times
300 occurs 3 times
400 occurs 4 times
450 occurs 3 times
500 occurs 2 times
600 occurs 6 times
Thus, the frequency distribution table of the above data may be presented as under
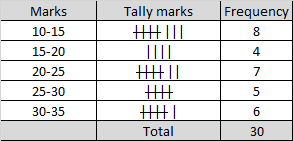
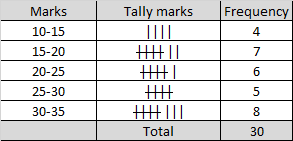
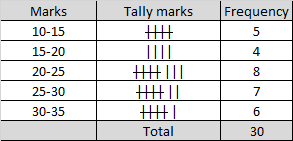
4.The marks obtained by 30 students of a class in an examination are given below : 34, 17, 16, 33, 16, 27, 19, 28, 30, 22, 32, 34, 24, 33, 27, 17, 31, 30, 23, 24, 18, 23, 27, 11, 10, 11, 19, 29, 13, 20 Construct a frequency table with equal class intervals, starting from 10-15 , where 15 is not included.
(a)
(b)
(c)
Answer
Answer: (b)
Explanation: Arranging the given observations in ascending order,
10 , 11 , 11 , 13 , 16 , 16 , 17 , 17 , 18 , 19 , 19 , 20 , 22 , 23 , 23 , 24 , 24 , 27 , 27 , 27 , 28 , 29 , 30 , 30 , 31 , 32 , 33 , 33 , 34 , 34
Here, we divide the data into 5 groups 10-15, 15-20, 20-25, 25-30, 30-35
Thus, the frequency distribution table may be given as under :
Data handling Class 8 MCQ Questions with Answers
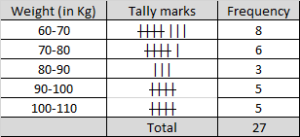
5.The weights(in kg) of 27 persons are given below : 108, 88, 61, 98, 99, 65, 100, 66, 68, 102, 104, 82, 70, 78, 64, 79, 65, 96, 75, 92, 62, 62, 107, 85, 95,76,109 Construct a frequency table with equal class intervals, starting from 60-70 , where 70 is not included.
(a)
(b)
(c)
Answer
Answer: (A)
Explanation: Arranging the given observation in ascending order,
61 , 62 , 62 , 64 , 65 ,65, 66 , 68, 70 , 72 , 75 , 76, 78 , 79 , 82 , 85 , 88 , 92 , 95 , 96 , 98 , 99 , 100 , 104 , 107 , 108, 109
Here, we divide the data into 5 groups 60-70 , 70-80 , 80-90 , 90-100 , 100-110
Thus, the frequency distribution table may be given as under :
6.The data given below shows the number of people in a city who can speak different languages
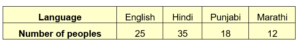
Find the central angle of the sector representing the people who can speak Hindi language in the pie chart ?
(a) 120˚
(b) 100˚
(c) 140˚
Answer
Answer: (c) 140˚
Explanation: Given:
Number of people who can speak English = 25
Number of people who can speak Hindi = 35
Number of people who can speak Punjabi = 18
Number of people who can speak Marathi = 12
As we know that,
Central angle for a component = ((Value of the component / Sum of all the values of all components) ×360)°
Total number of people = 25 + 35 + 18 + 12 = 90
Central angle for people who can speak Hindi = ((Number of people who can speak Hindi/Total number of peoples)×360)°
Central angle for people who can speak Hindi = ((35/90)×360)°
Central angle for people who can speak Hindi = (35 x 4)°
Central angle for people who can speak Hindi = 140˚
7.A man with a monthly salary of ₹ 12000 plans his budget for a month as given below:
![]()
Find the central angle of the sector representing food in the pie chart ?
(a) 64˚
(b) 68˚
(c) 72˚
Answer
Answer: (c) 72˚
Explanation: Salary = ₹ 12000
Rent = ₹ 3000
Food = ₹ 2400
Clothes = ₹ 1200
Education = ₹ 1800
Savings = ₹ 1500
Miscellaneous = ₹ 2100
As we know that,
Central angle for a component = ((Value of the component / Sum of all the values of all components) ×360)°
Central angle for Food = ((Expenditure on Food /Salary)×360)°
Central angle for Food = ((2400/12000)×360)°
Central angle for Food = ((1/5)×360)°
Central angle for Food = 72˚:
8.When a coin is tossed then, the probability of getting head is?
(a) 1/2
(b) 2/3
Answer
Answer: (a) 1/2
Explanation:
Probability of occurrence of an event ( E ) is the ratio of favourable outcome to the total number of outcome.
i.e., P(E)=Number of favourable outcome /Total number of outcome
Possible Outcomes = ( H , T )
Total number of possible outcomes = 2
Number of heads = 1
P(H) = Number of head /Total Number of Outcomes
P(H) =1/2
Data handling Class 8 MCQ Questions with Answers
9.A bag contains 3 red , 5 yellow and 7 green balls. One ball is drawn at random. The probability of getting a green ball is?
(a) 1/5
(b) 7/15
Answer
Answer: (b) 7/15
Explanation: Probability of occurrence of an event ( E ) is the ratio of favourable outcome to the total number of outcome.
i.e., P(E)=Number of favourable outcome /Total number of outcome
Number of red balls = 3
Number of yellow balls = 5
Number of green balls = 7
Total number of balls = Number of red balls + Number of yellow balls + Number of green balls
Total number of balls = 3 + 5 + 7
Total number of balls = 15
P(getting a green ball)=Number of green balls /Total number of balls
P( getting a green ball ) =7/15
10.There are 6 green and 4 blue sectors in a spinning wheel. It is spinned. Find the probability of getting a green sector?
(a) 3/5
(b) 2/5
Answer
Answer: (a) 3/5
Explanation: Probability of occurrence of an event ( E ) is the ratio of favourable outcome to the total number of outcome.
i.e., P(E)=Number of favourable outcome /Total number of outcome
Number of green sectors = 6
Number of blue sectors = 4
Total number of sectors = Number of green sectors + Number of blue sectors
Total number of sectors = 6 + 4
Total number of sectors = 10
P(getting a green sector)=Number of green sectors /Total number of sectors
P( getting a green sector ) =6/10
P( getting a green sector ) =3/5
12.A bag contains 12 balls numbered 1, 2, 3, 4…… 12 respectively. A ball is drawn at random. Find the probability of getting a ball containing number less than 6 ?
(a) 5/12
(b) 1/2
Answer
Answer: (a) 5/12
Explanation:
Probability of occurrence of an event ( E ) is the ratio of favourable outcome to the total number of outcome.
i.e., P(E)=Number of favourable outcome /Total number of outcome
Possible outcomes = ( 1, 2, 3, 4, 5, 6, 7, 8, 9, 10, 11, 12 )
Total number of possible outcomes = 12
Favourable outcome = Getting a ball having number less than 6
Favourable outcome = 1 , 2 , 3 , 4 , 5
Number of favourable outcomes = 5
P(getting a ball having number less than 6) =5/12
MCQ Questions for Class 8 Maths with Answers
- Linear Equations in One Variable Class 8 MCQ Questions
- Understanding Quadrilaterals Class 8 MCQ Questions
- Square and Square Roots Class 8 MCQ with Answers
- Cube and Cube Roots Class 8 MCQ Questions
- Comparing Quantities Class 8 MCQ Questions
- Mensuration Class 8 MCQ Questions
- Exponents and Powers Class 8 MCQ
- Direct and Inverse Proportion Class 8 MCQ Questions
- Factorization Class 8 MCQ Questions
- Introduction to graphs Class 8 MCQ Questions
- Playing with Numbers Class 8 MCQ Questions
- Time and Work Class 8 MCQ Questions
Frequently Asked Questions on Data handling Class 8 MCQ Questions with Answers
1. Are these MCQs on Data handling Class 8 are based on 2021-22 CBSE Syllabus?
Yes. There are 12 MCQ’s on this Chapter in this blog.
2. Are you giving all the chapters of Maths Class 8 MCQs with Answers which are given in CBSE syllabus for 2021-22 ?
Yes, we are providing all the chapters of Maths Class 8 MCQs with Answers.