Revenue Curves Under Perfect competition
The revenue curve of a firm is majorly represented by the Average Revenue and Marginal Revenue curves of a firm. These curves show the behaviour of the revenue of a firm. Let us see how the revenue curve of a firm behaves under perfect competition
| Topic | Revenue Curves Under Perfect competition |
| Subject | Microeconomics |
| Category | CBSE Class 11 Notes |
What is Perfect Competition?
Perfect competition refers to a market situation where there are a very large number of buyers and sellers who deal in identical product. Under perfect competition, the price of the commodity is fixed by the market. There are a huge number of sellers selling identical products, therefore a single producer cannot influence the price by changing the level of output. Thus the firms are called price takers. They have no market control and receive the market price for their output.
Average Revenue & Marginal Revenue Curves under Perfect Competition
In perfect competition. a firm has to accept the same price as determined by the industry. The firm can sell any quantity of a commodity at that particular price. Therefore, it can be said that the price remains constant. When the price remains same at every level of output, it means that no firm is in the position to influence the price. This means that, the revenue from every additional unit (MR) is equal to AR. We also know that AR is equal to price since,
TR = Quantity × Price
AR = TR/Quantity = Quantity × Price/ Quantity
Therefore, AR = Price
As a result both AR and MR curves coincide in a horizontal straight line parallel to the x-axis.
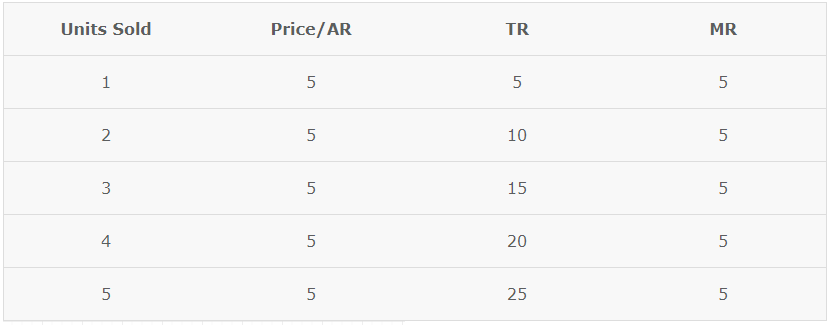
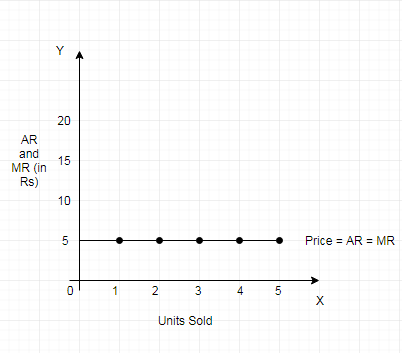
As seen in the given schedule and diagram, price or AR remains constant at all levels of output and are equal to MR. As a result, AR curve is perfectly elastic. This means a firm can sell any quantity of output at the constant price.
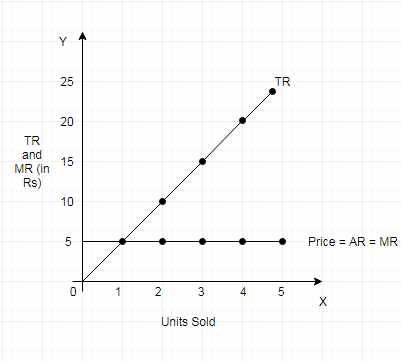
Total Revenue Curve Under Perfect Competition
When price remains constant, firms can sell any quantity of output at the given price. As a result, the MR or AR curve is a horizontal straight line parallel to the x-axis. Since MR remains constant, TR also increases at a constant rate. Due to this, the TR curve is a positively sloped straight line. As TR is zero at zero level of output, the TR curve starts from the origin.
Producer Behaviour and Supply
- Concept of Production Function
- Total Product, Marginal Product & Average Product
- Law of Variable Proportion
- Relationship Between Total Product Average Product and Marginal Product
- Cost Concept in Economics
- Short run cost
- Relationship between Total Cost Marginal Cost and Average Cost
- What is Revenue
- Revenue curve under perfect competition
- Producer’s Equilibrium
- Concept of supply
- Supply Schedule
- Supply Curve
- Determinants of Supply
- Law of Supply
- Movement along the supply curve
- Shift in Supply Curve
- Price Elasticity of Supply