Supply Curve Class 11 Notes
The supply schedule shows the combinations of different quantities of a commodity that a producer is willing to sell at different levels of price. The graphical representation of a supply schedule is known as a Supply Curve.
| Topic | Supply Curve |
| Subject | Microeconomics |
| Category | CBSE Class 11 Notes |
Supply Curve
A Supply Curve is the locus of all the points showing various quantities of a commodity that a producer is willing to offer for sale at various levels of prices, during a given period of time, assuming no change in other factors.
This shows that there is direct relationship between price and the amount of a commodity that will be supplied by a producer or a firm, keeping other factors constant. It can be drawn for any commodity by plotting each combination of a supply schedule on a graph. It can be drawn for both the types of supply schedules – individual and market supply schedule. Therefore, it is of two types – Individual and Market.
Individual Supply Curve
An individual supply curve is a graphical representation of an individual supply schedule.
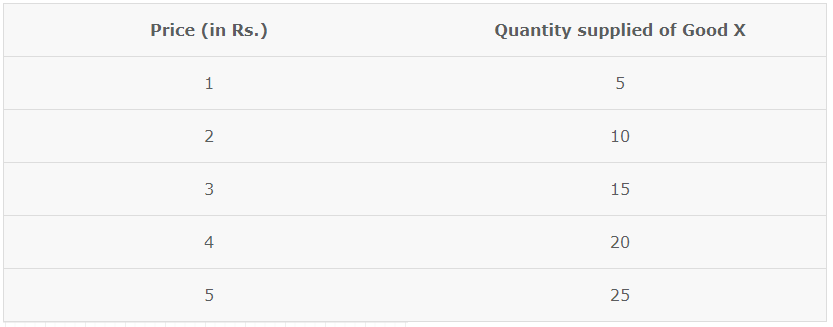
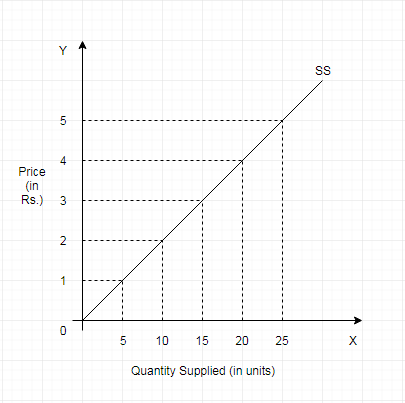
SS is obtained by plotting points shown in the schedule given above. At every possible price, the firm is willing to sell a specific amount of its commodity. By joining all these points we obtain a curve that slopes upwards. This is due to the positive relationship between the price of a commodity and the quantity supplied.
Market Supply Curve
Market supply curve is a graphical representation of a market supply schedule. We obtain it through horizontal summation of individual supply curves.
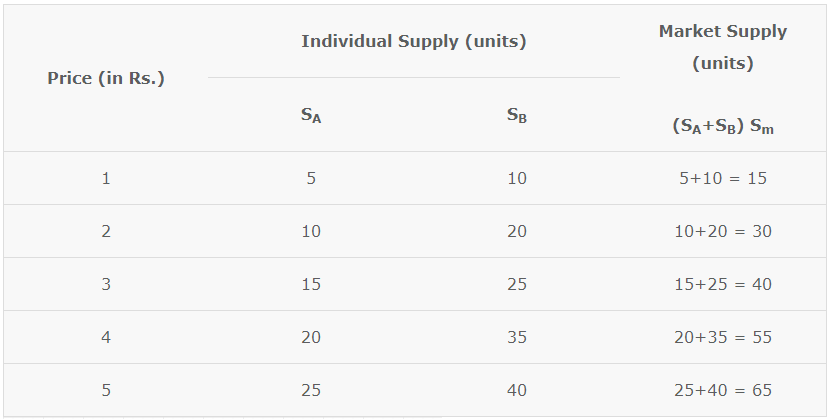
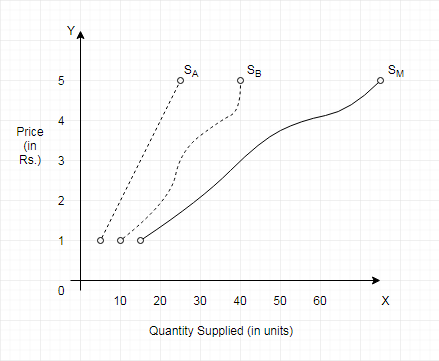
The points in market supply schedule given in the above table are graphically represented in the given graph. Sm has been obtained by horizontal summation of SA and SB.
A market supply curve is flatter than all the individual supply curves, because with change in price, the proportionate change in market supply is more than the proportionate change in individual supply.
Slope of a Supply Curve
The slope of a curve is defined as a change in the variable on the Y-axis divided by the change in the variable on the X-axis. Therefore, the slope of a supply curve is the Change in Price divided by the Change in Quantity Supplied.
Slope of Supply Curve = Change in Price (ΔP)/Change in Quantity (ΔQ)
Due to the direct relationship between supply and price, the curve slopes upwards i.e. the slope is positive. The slope measures the flatness or steepness of the curve. So it is based on the absolute change in price and quantity.
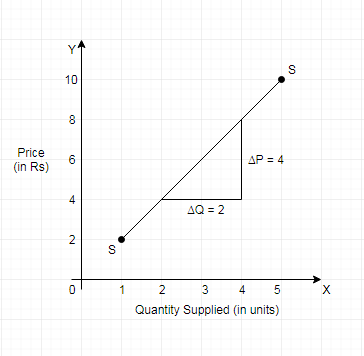
When the price rises from Rs. 4 to Rs. *, Then the quantity rises from 2 units to 4 units. Therefore,
Slope = Change in Price (ΔP)/Change in Quantity (ΔQ)
Change in Price (ΔP)/Change in Quantity (ΔQ) = 8-4/4-2 = 2
Producer Behaviour and Supply
- Concept of Production Function
- Total Product, Marginal Product & Average Product
- Law of Variable Proportion
- Relationship Between Total Product Average Product and Marginal Product
- Cost Concept in Economics
- Short run cost
- Relationship between Total Cost Marginal Cost and Average Cost
- What is Revenue
- Revenue curve under perfect competition
- Producer’s Equilibrium
- Concept of supply
- Supply Schedule
- Supply Curve
- Determinants of Supply
- Law of Supply
- Movement along the supply curve
- Shift in Supply Curve
- Price Elasticity of Supply