Relationship Between Total Product Average Product and Marginal Product Class 11 Notes
There is a unique relationship between total product (TP) and marginal product (MP) and between marginal product (MP) and average product (AP). It is very important to understand the relationship between these concepts in order to understand the process behind production by firms.
| Topic | Relationship Between Total Product Average Product and Marginal Product |
| Subject | Microeconomics |
| Category | CBSE Class 11 Notes |
Relationship between Total Product and Marginal Product
The relationship between TP and MP is explained through the Law of Variable Proportions. As long as the the TP increases at an increasing rate, the MP also increases. This goes on till MP reaches maximum. When TP increases at a diminishing rate, MP declines. This continues till the point where TP is at its highest. When TP reaches its maximum point, MP becomes zero. This concept can be better understood with the help of the following schedule and diagram.
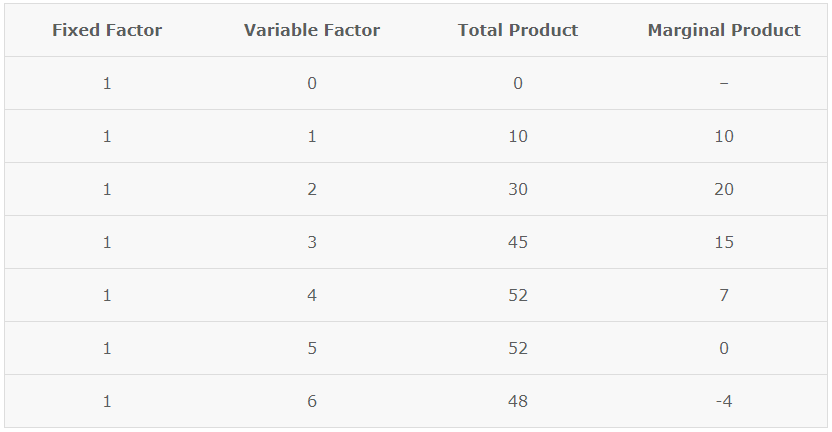
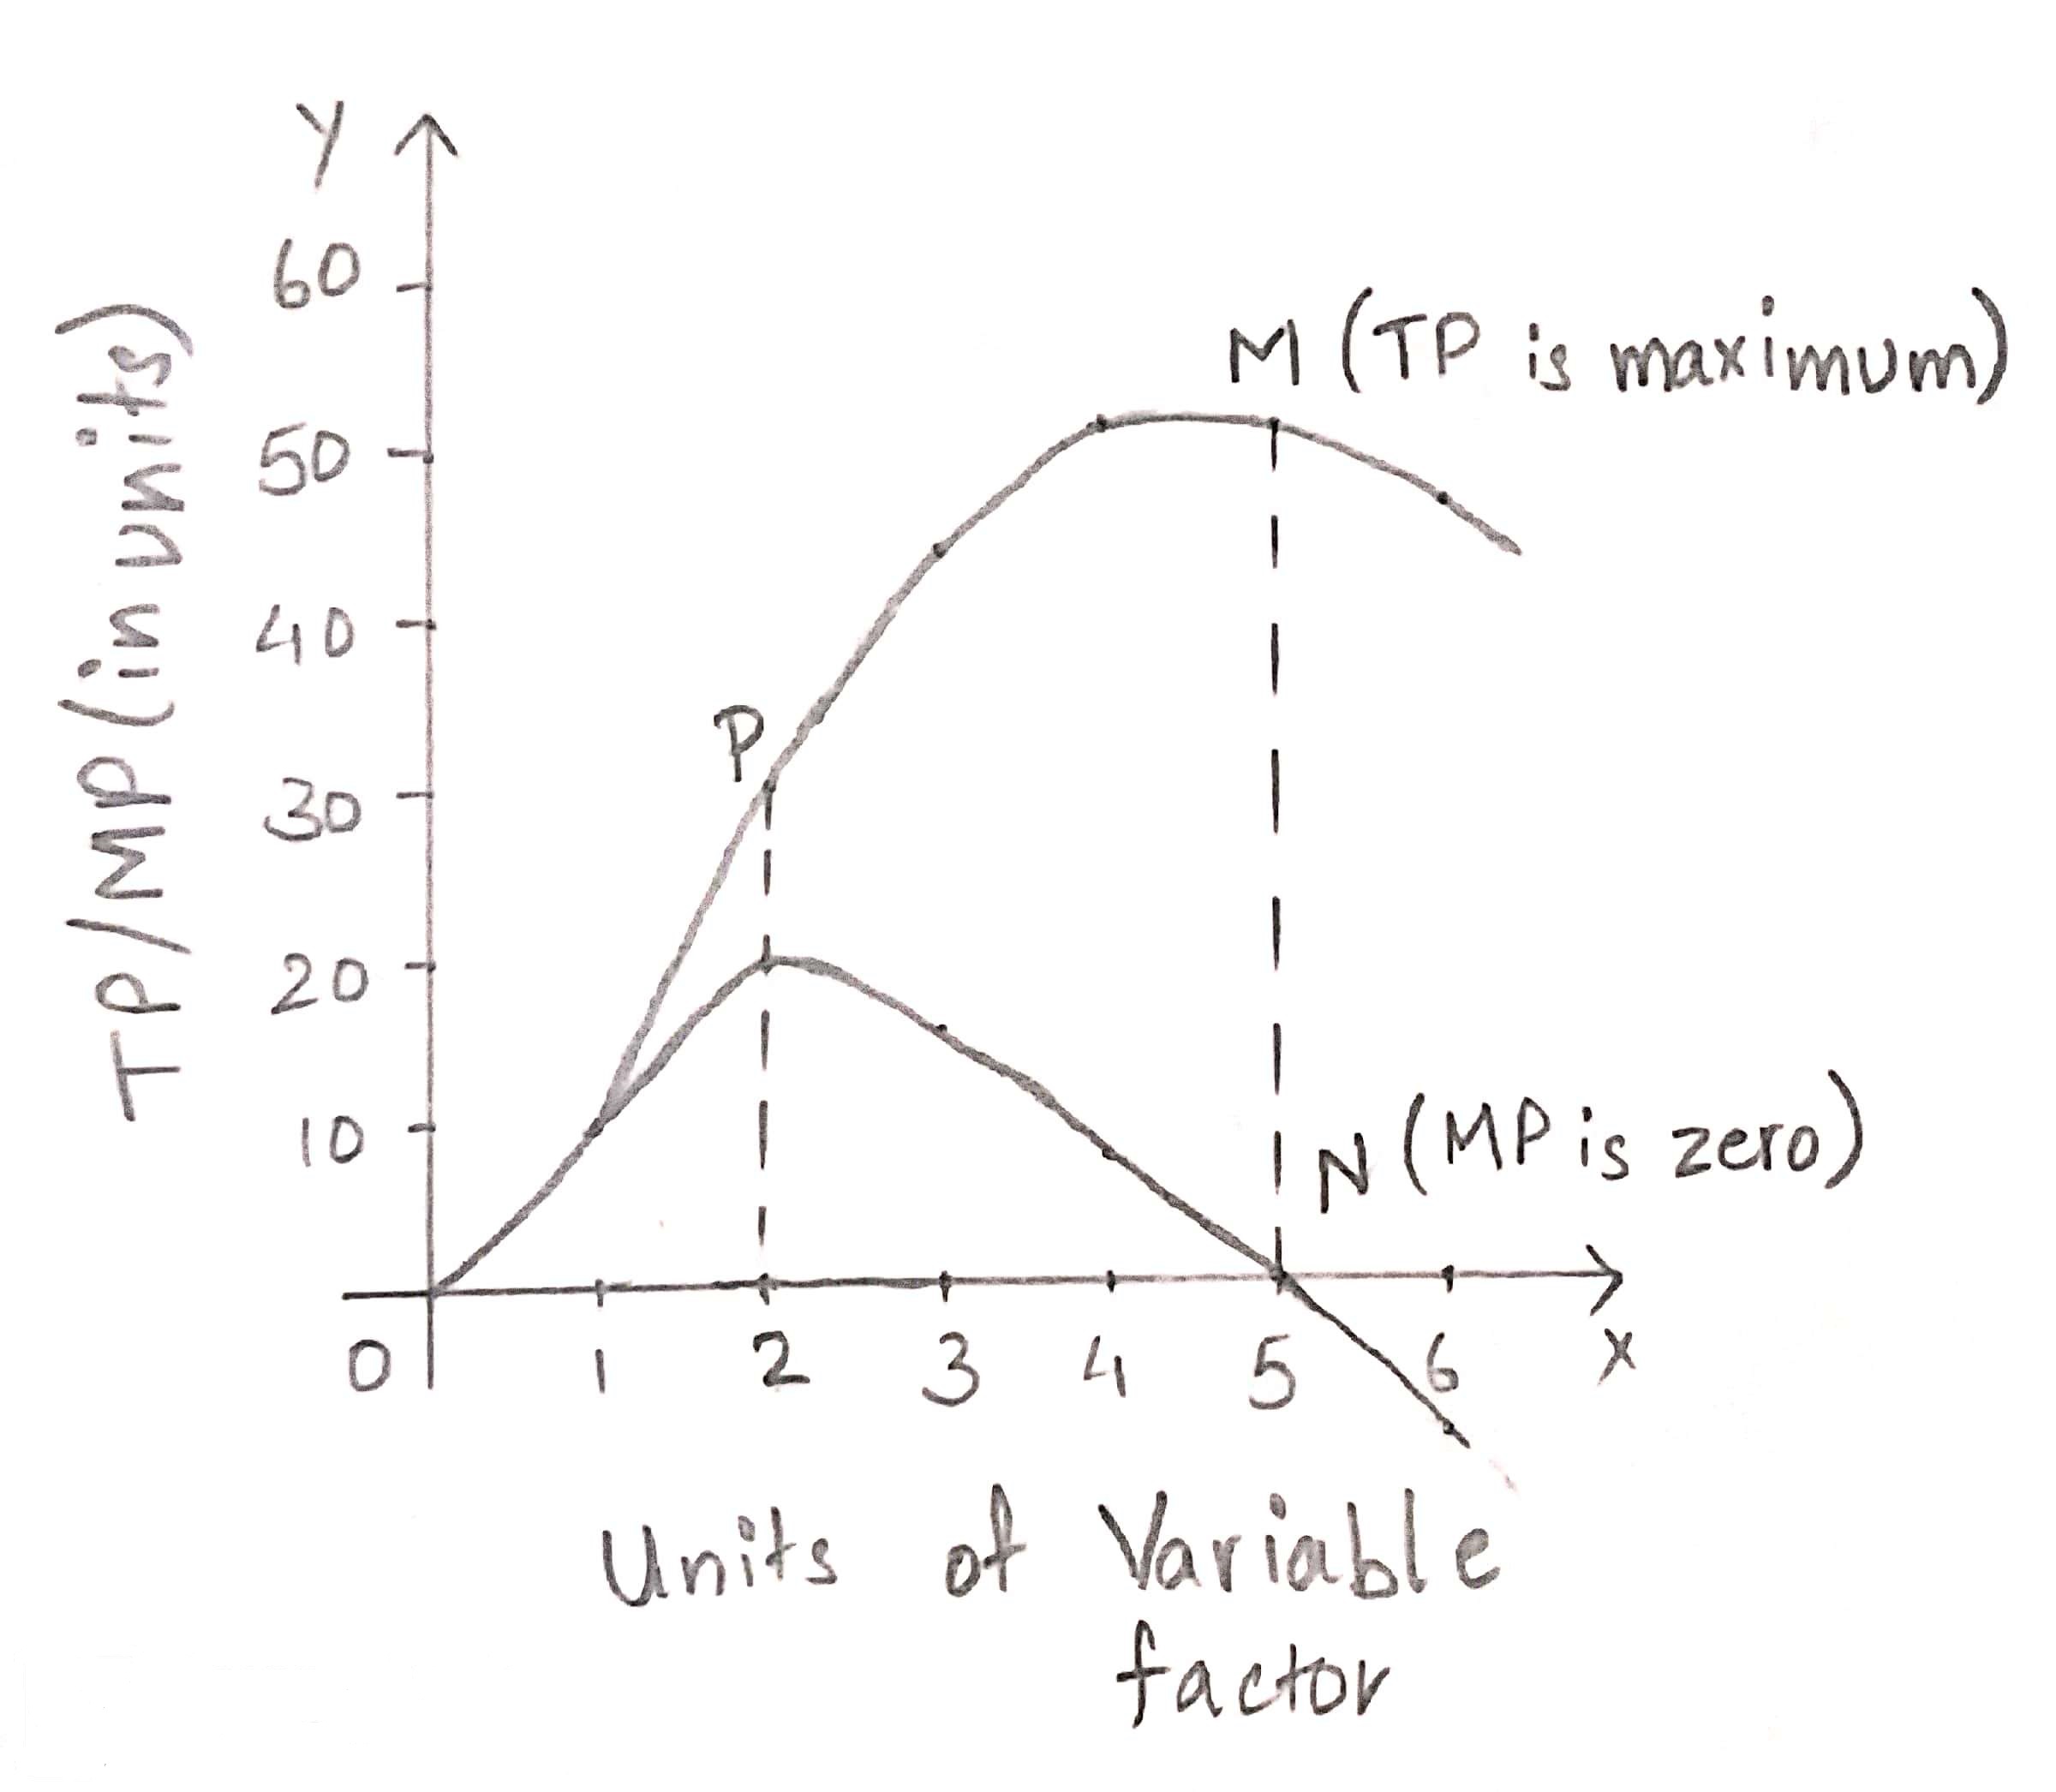
As you can see in the graph, TP increases at an increasing rate till point P, the point of inflextion, and till that point (i.e. the 2nd unit of variable factor), MP increases. Then, as the TP start increasing at a diminishing rate till point M when TP is maximum., the MP keeps declining and reaches zero at point N. This happens at the 6th unit of variable factor. After this point, the TP start decreasing and MP becomes negative, which can be seen when the 7th unit of variable factor is employed.
Relationship between Marginal Product and Average Product
The marginal product (MP) and average product (AP) initially increase and then decrease due to the operation of the Law of Diminishing Marginal Returns. As long as MP is higher than AP, AP increases. At the highest point of AP, i.e. when AP is at its maximum, MP is equal to AP. When MP becomes lesser than AP, AP also starts to fall. Thereafter, both AP and MP fall, but MP becomes negative and AP remains positive. Also, MP falls at a faster rate as compared to AP. This can be better understood with the help of the following schedule and diagram.
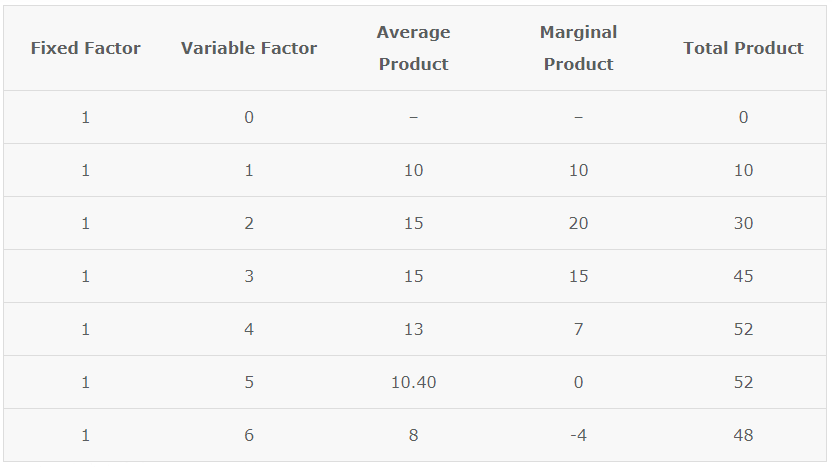
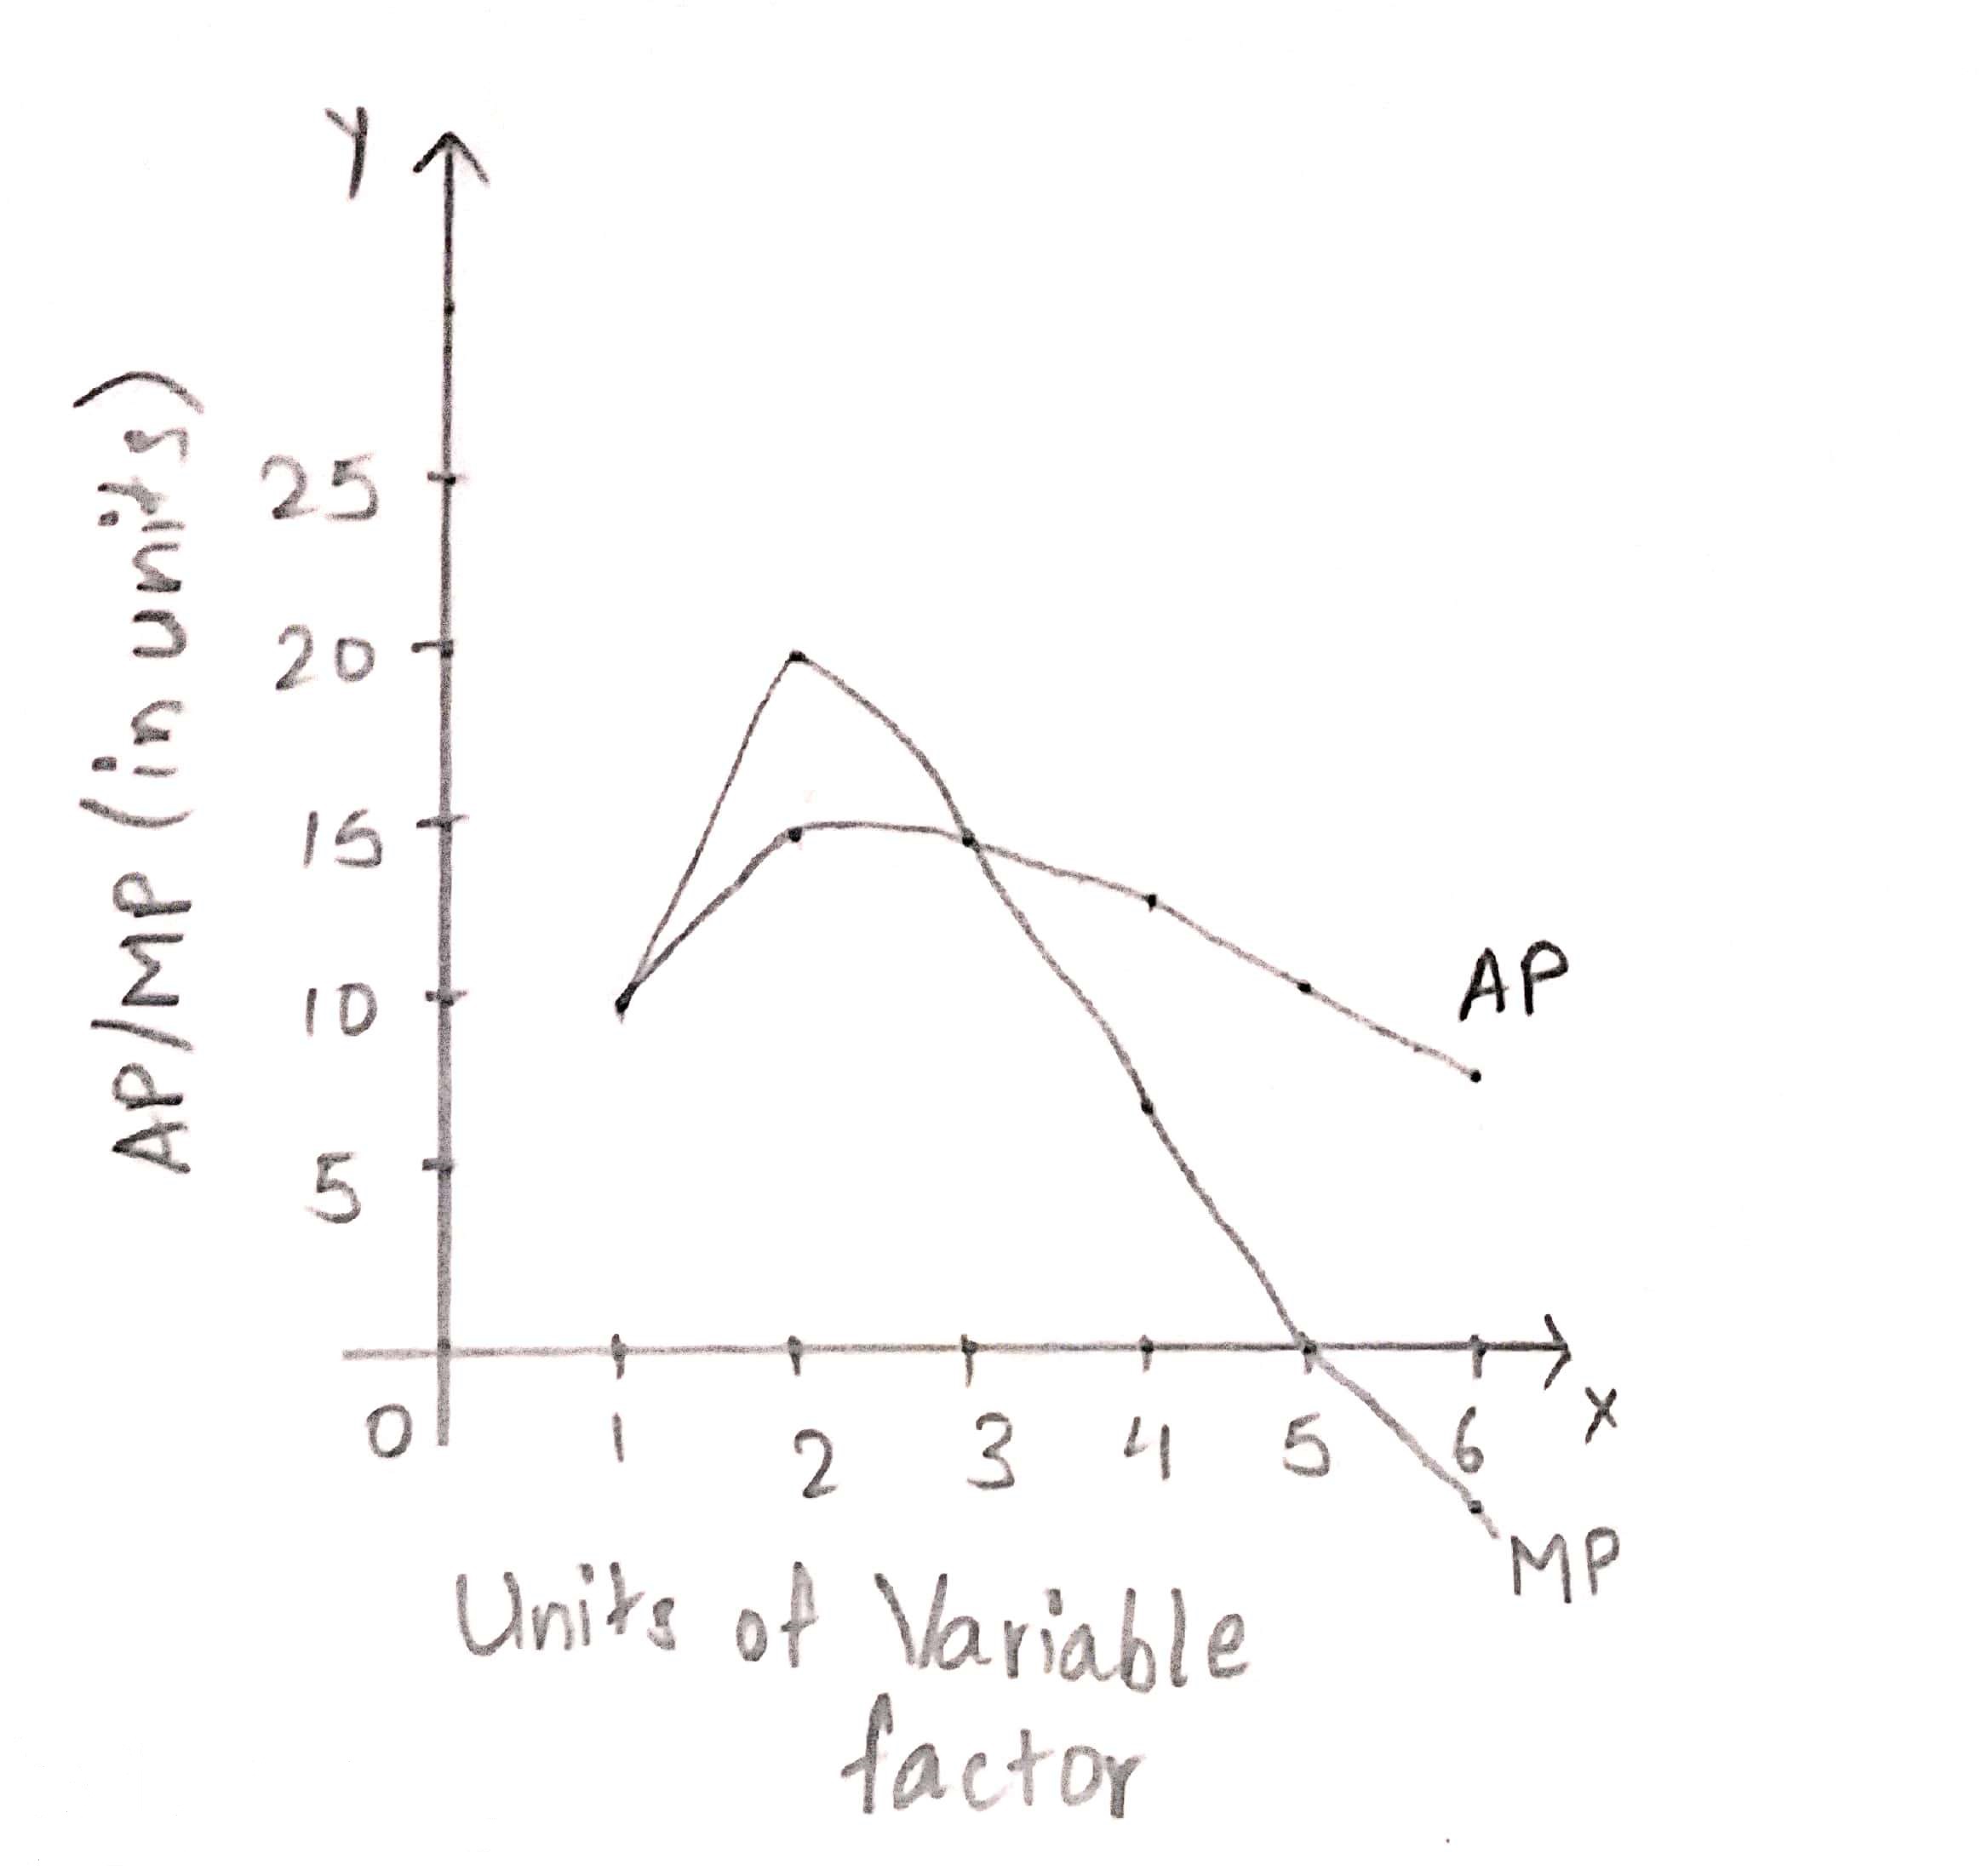
As seen in the above given graph, as long as MP is more than AP, AP rises, i.e. till the 2nd unit of variable factor. When MP and AP become equal at the 3rd unit, AP is at its highest. When MP becomes less than AP, from the 4th unit of variable factor, AP falls. After that, both MP and AP fall but the curve of MP is steeper than that of AP, and AP remains positive while MP becomes negative.
Producer Behaviour and Supply
- Concept of Production Function
- Total Product, Marginal Product & Average Product
- Law of Variable Proportion
- Relationship Between Total Product Average Product and Marginal Product
- Cost Concept in Economics
- Short run cost
- Relationship between Total Cost Marginal Cost and Average Cost
- What is Revenue
- Revenue curve under perfect competition
- Producer’s Equilibrium
- Concept of supply
- Supply Schedule
- Supply Curve
- Determinants of Supply
- Law of Supply
- Movement along the supply curve
- Shift in Supply Curve
- Price Elasticity of Supply
2 thoughts on “Relationship Between Total Product Average Product and Marginal Product Class 11 Notes”
good explanation
Great explanation