Download NCERT Solutions for Class 9 Maths Chapter 4 Exercise 4.3 – Linear Equations in two Variables. This Exercise contains 8 questions, for which detailed answers have been provided in this note. In case you are looking at studying the remaining Exercise for Class 9 for Maths NCERT solutions for Chapter 4 or other Chapters, you can click the link at the end of this Note.
NCERT Solutions for Class 9 Maths Chapter 4 Exercise 4.3 Question 2
NCERT Solutions for Class 9 Maths Chapter 4 Exercise 4.3 Question 3
NCERT Solutions for Class 9 Maths Chapter 4 Exercise 4.3 Question 4
NCERT Solutions for Class 9 Maths Chapter 4 Exercise 4.3 Question 5
NCERT Solutions for Class 9 Maths Chapter 4 Exercise 4.3 – Linear Equations in two Variables
NCERT Solutions for Class 9 Maths Chapter 4 Exercise 4.3 – Linear Equations in two Variables
1.Draw the graph of each of the following linear equations in two variables:
(i) x + y = 4
(ii) x – y = 2
(iii) y = 3x
(iv) 3 = 2x + y
Solution :
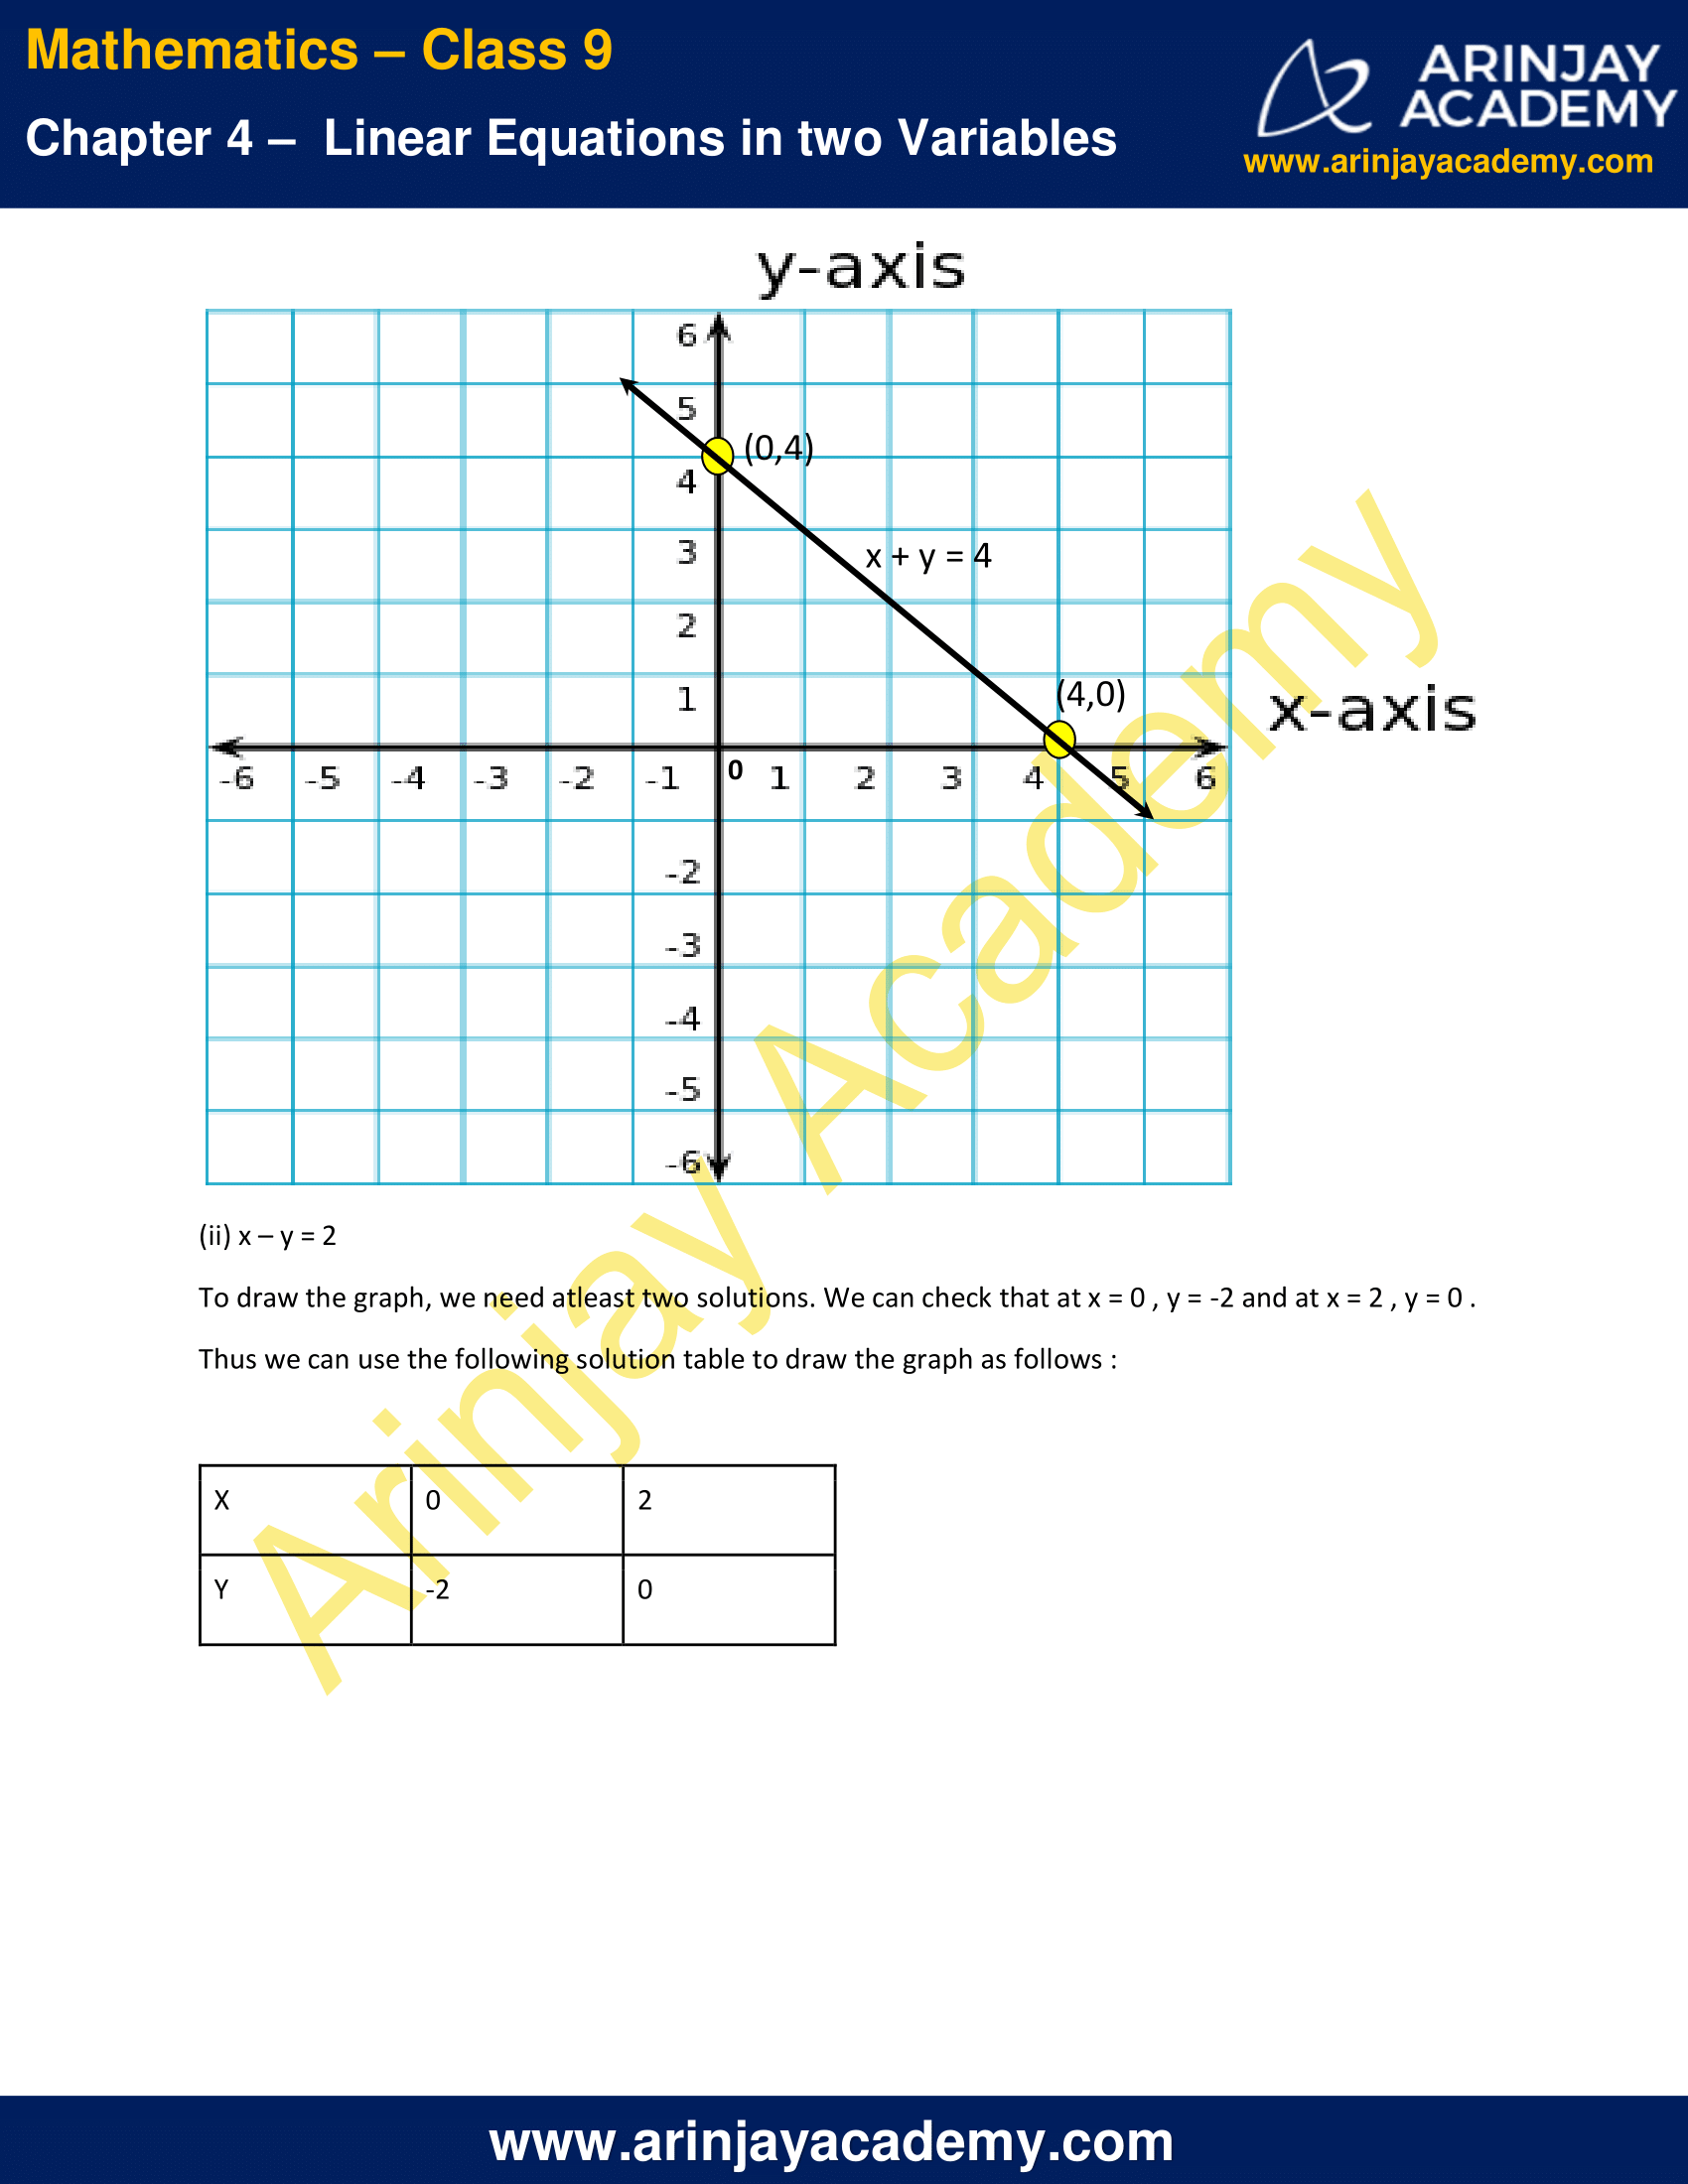
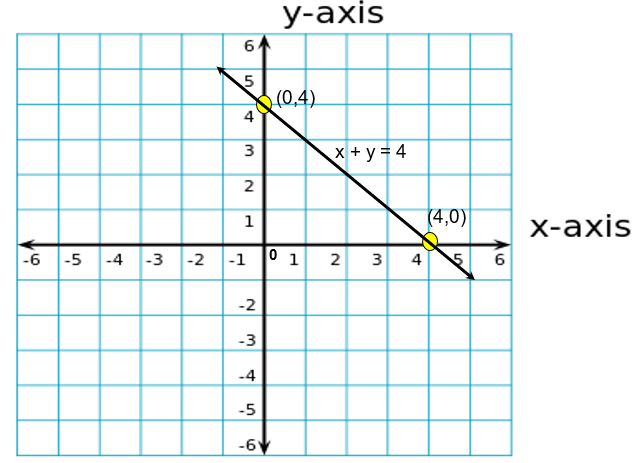
(i) x + y = 4
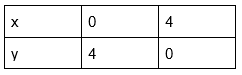
To draw the graph we need atleast two solutions. We can check that at x = 0 , y = 4 and at x = 4 , y = 0 .
Thus we can use the following solution table to draw the graph as follows :
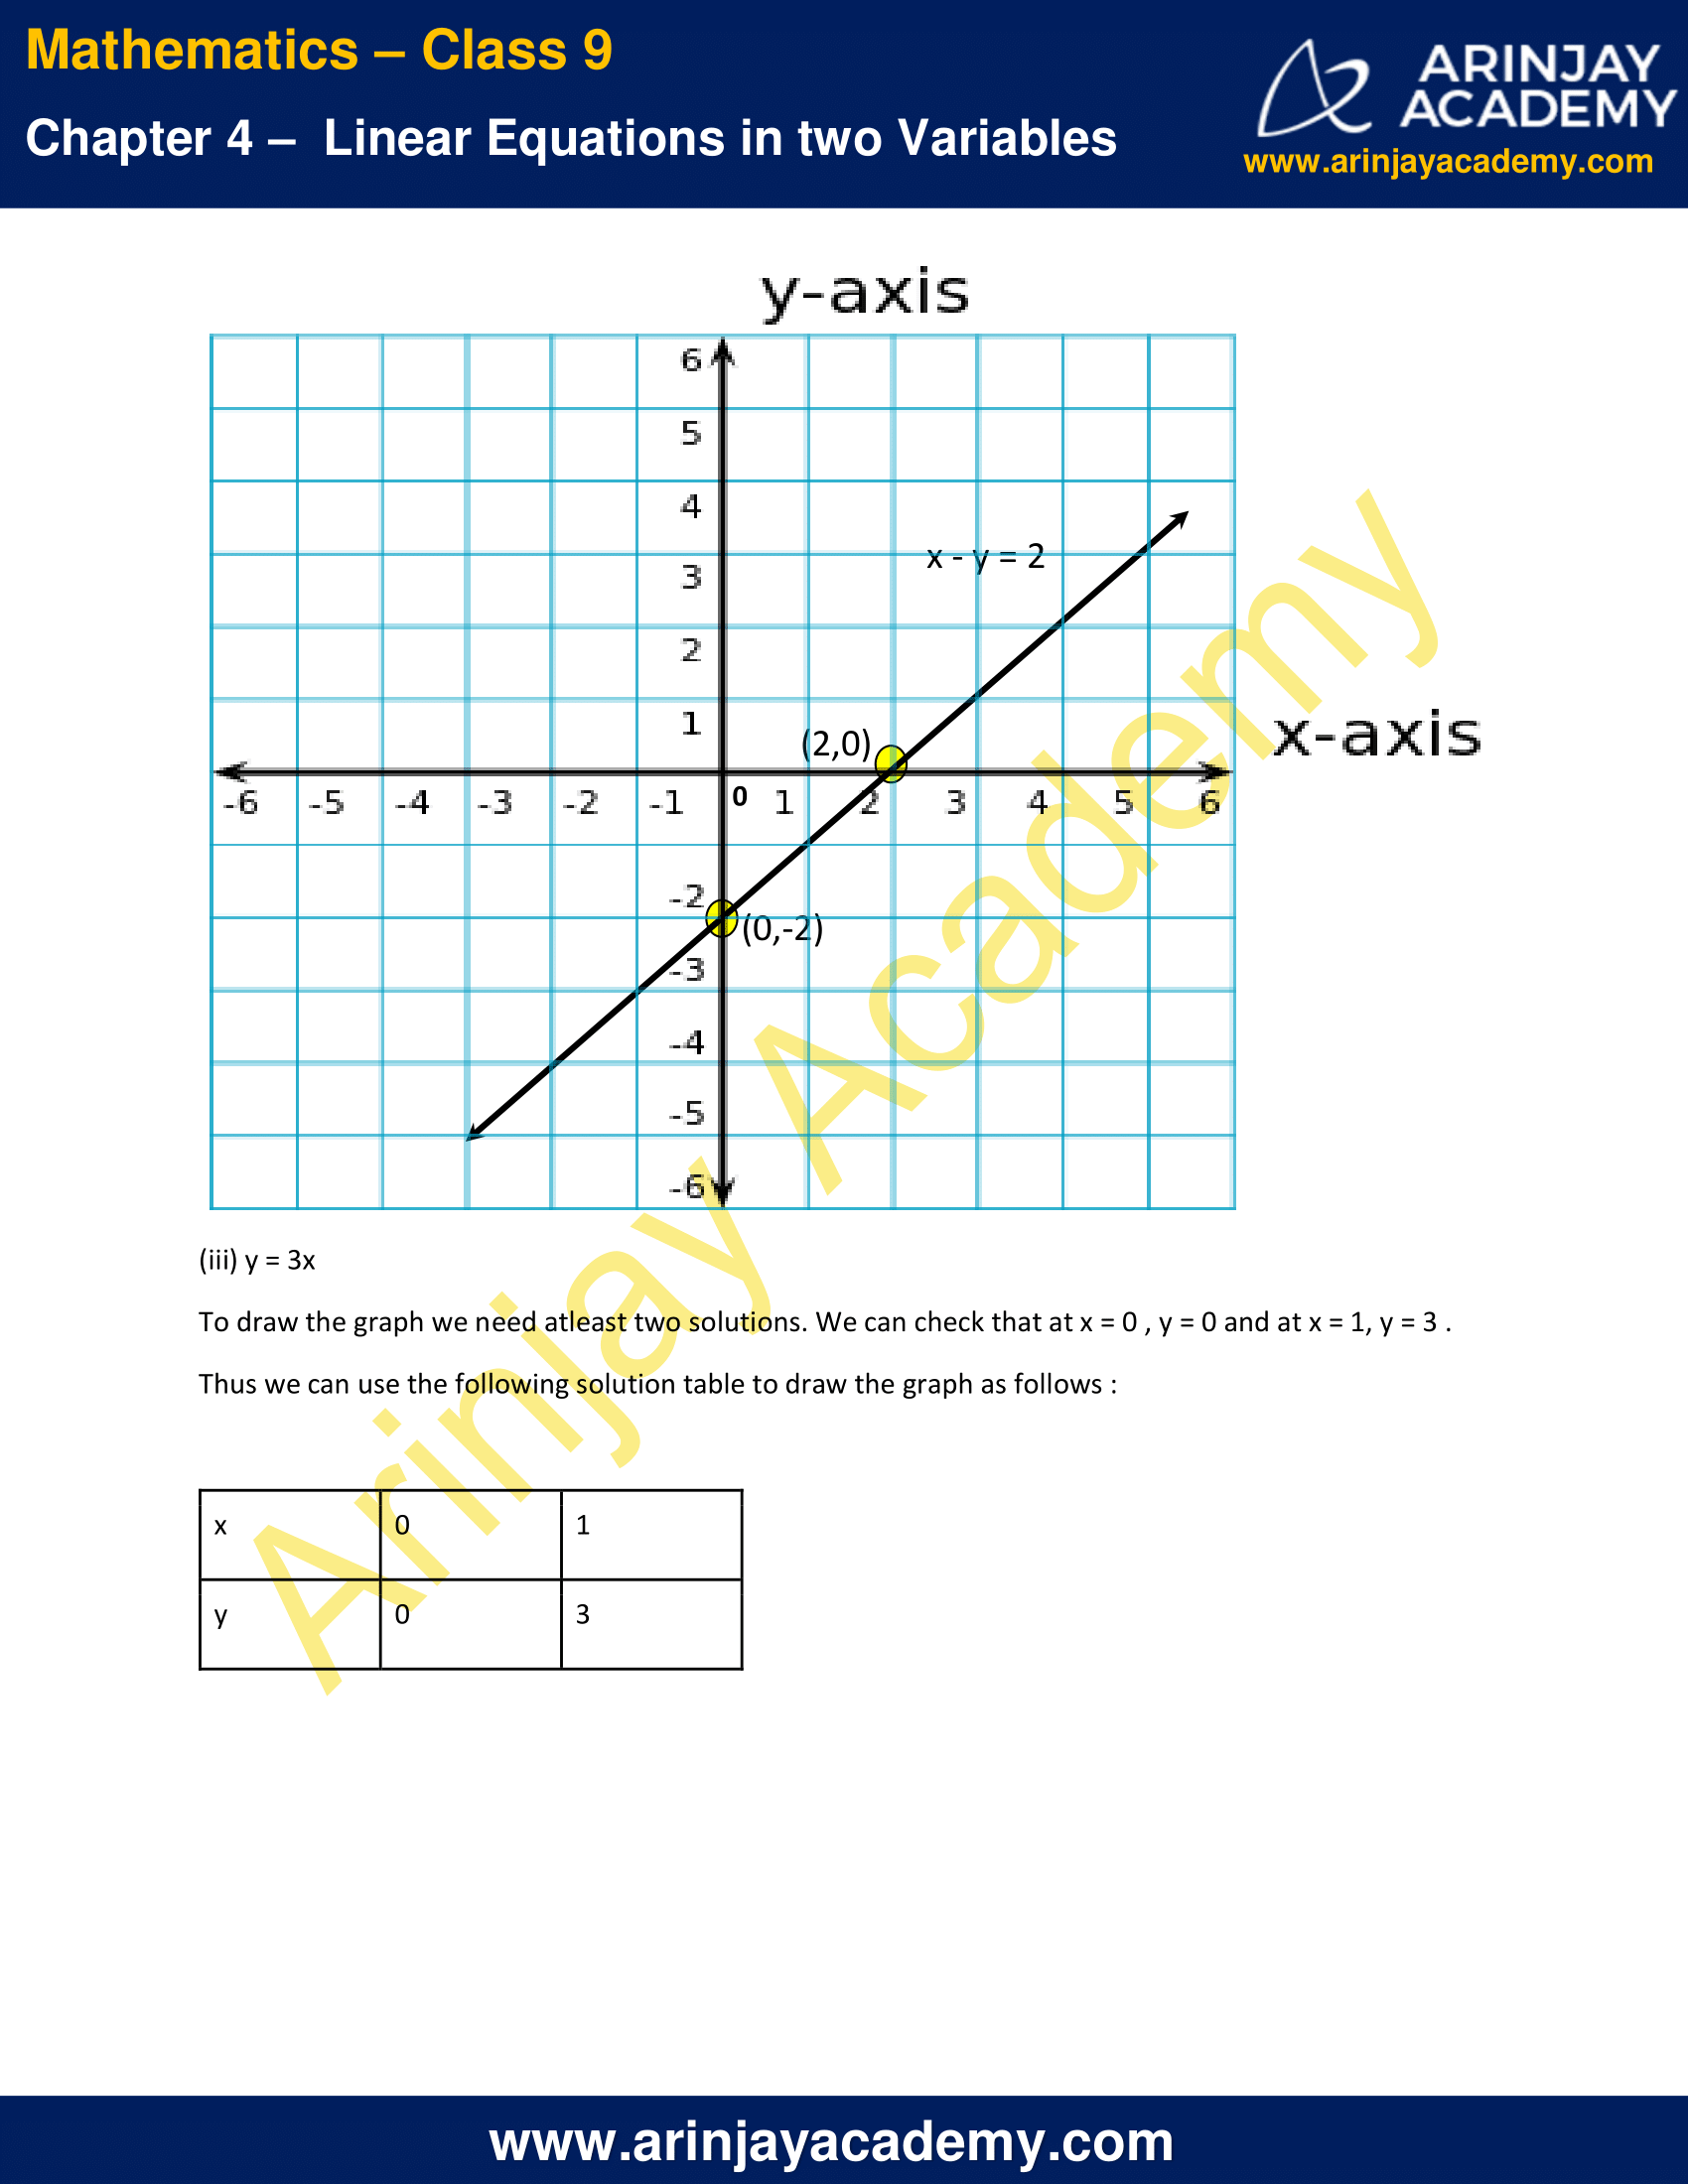
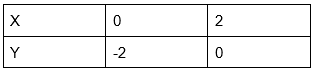
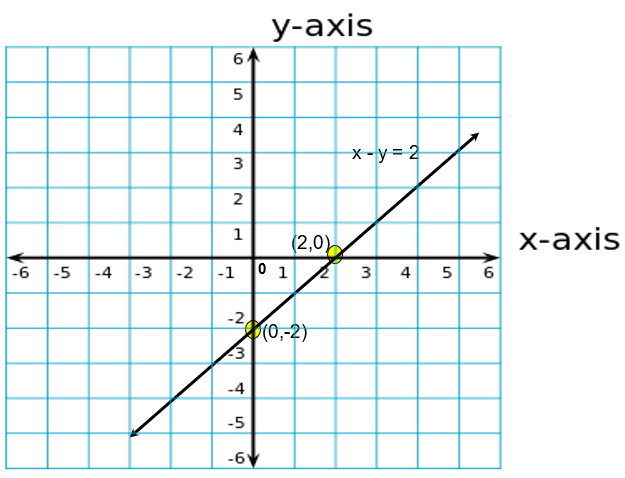
(ii) x – y = 2
To draw the graph, we need atleast two solutions. We can check that at x = 0 , y = -2 and at x = 2 , y = 0 .
Thus we can use the following solution table to draw the graph as follows :
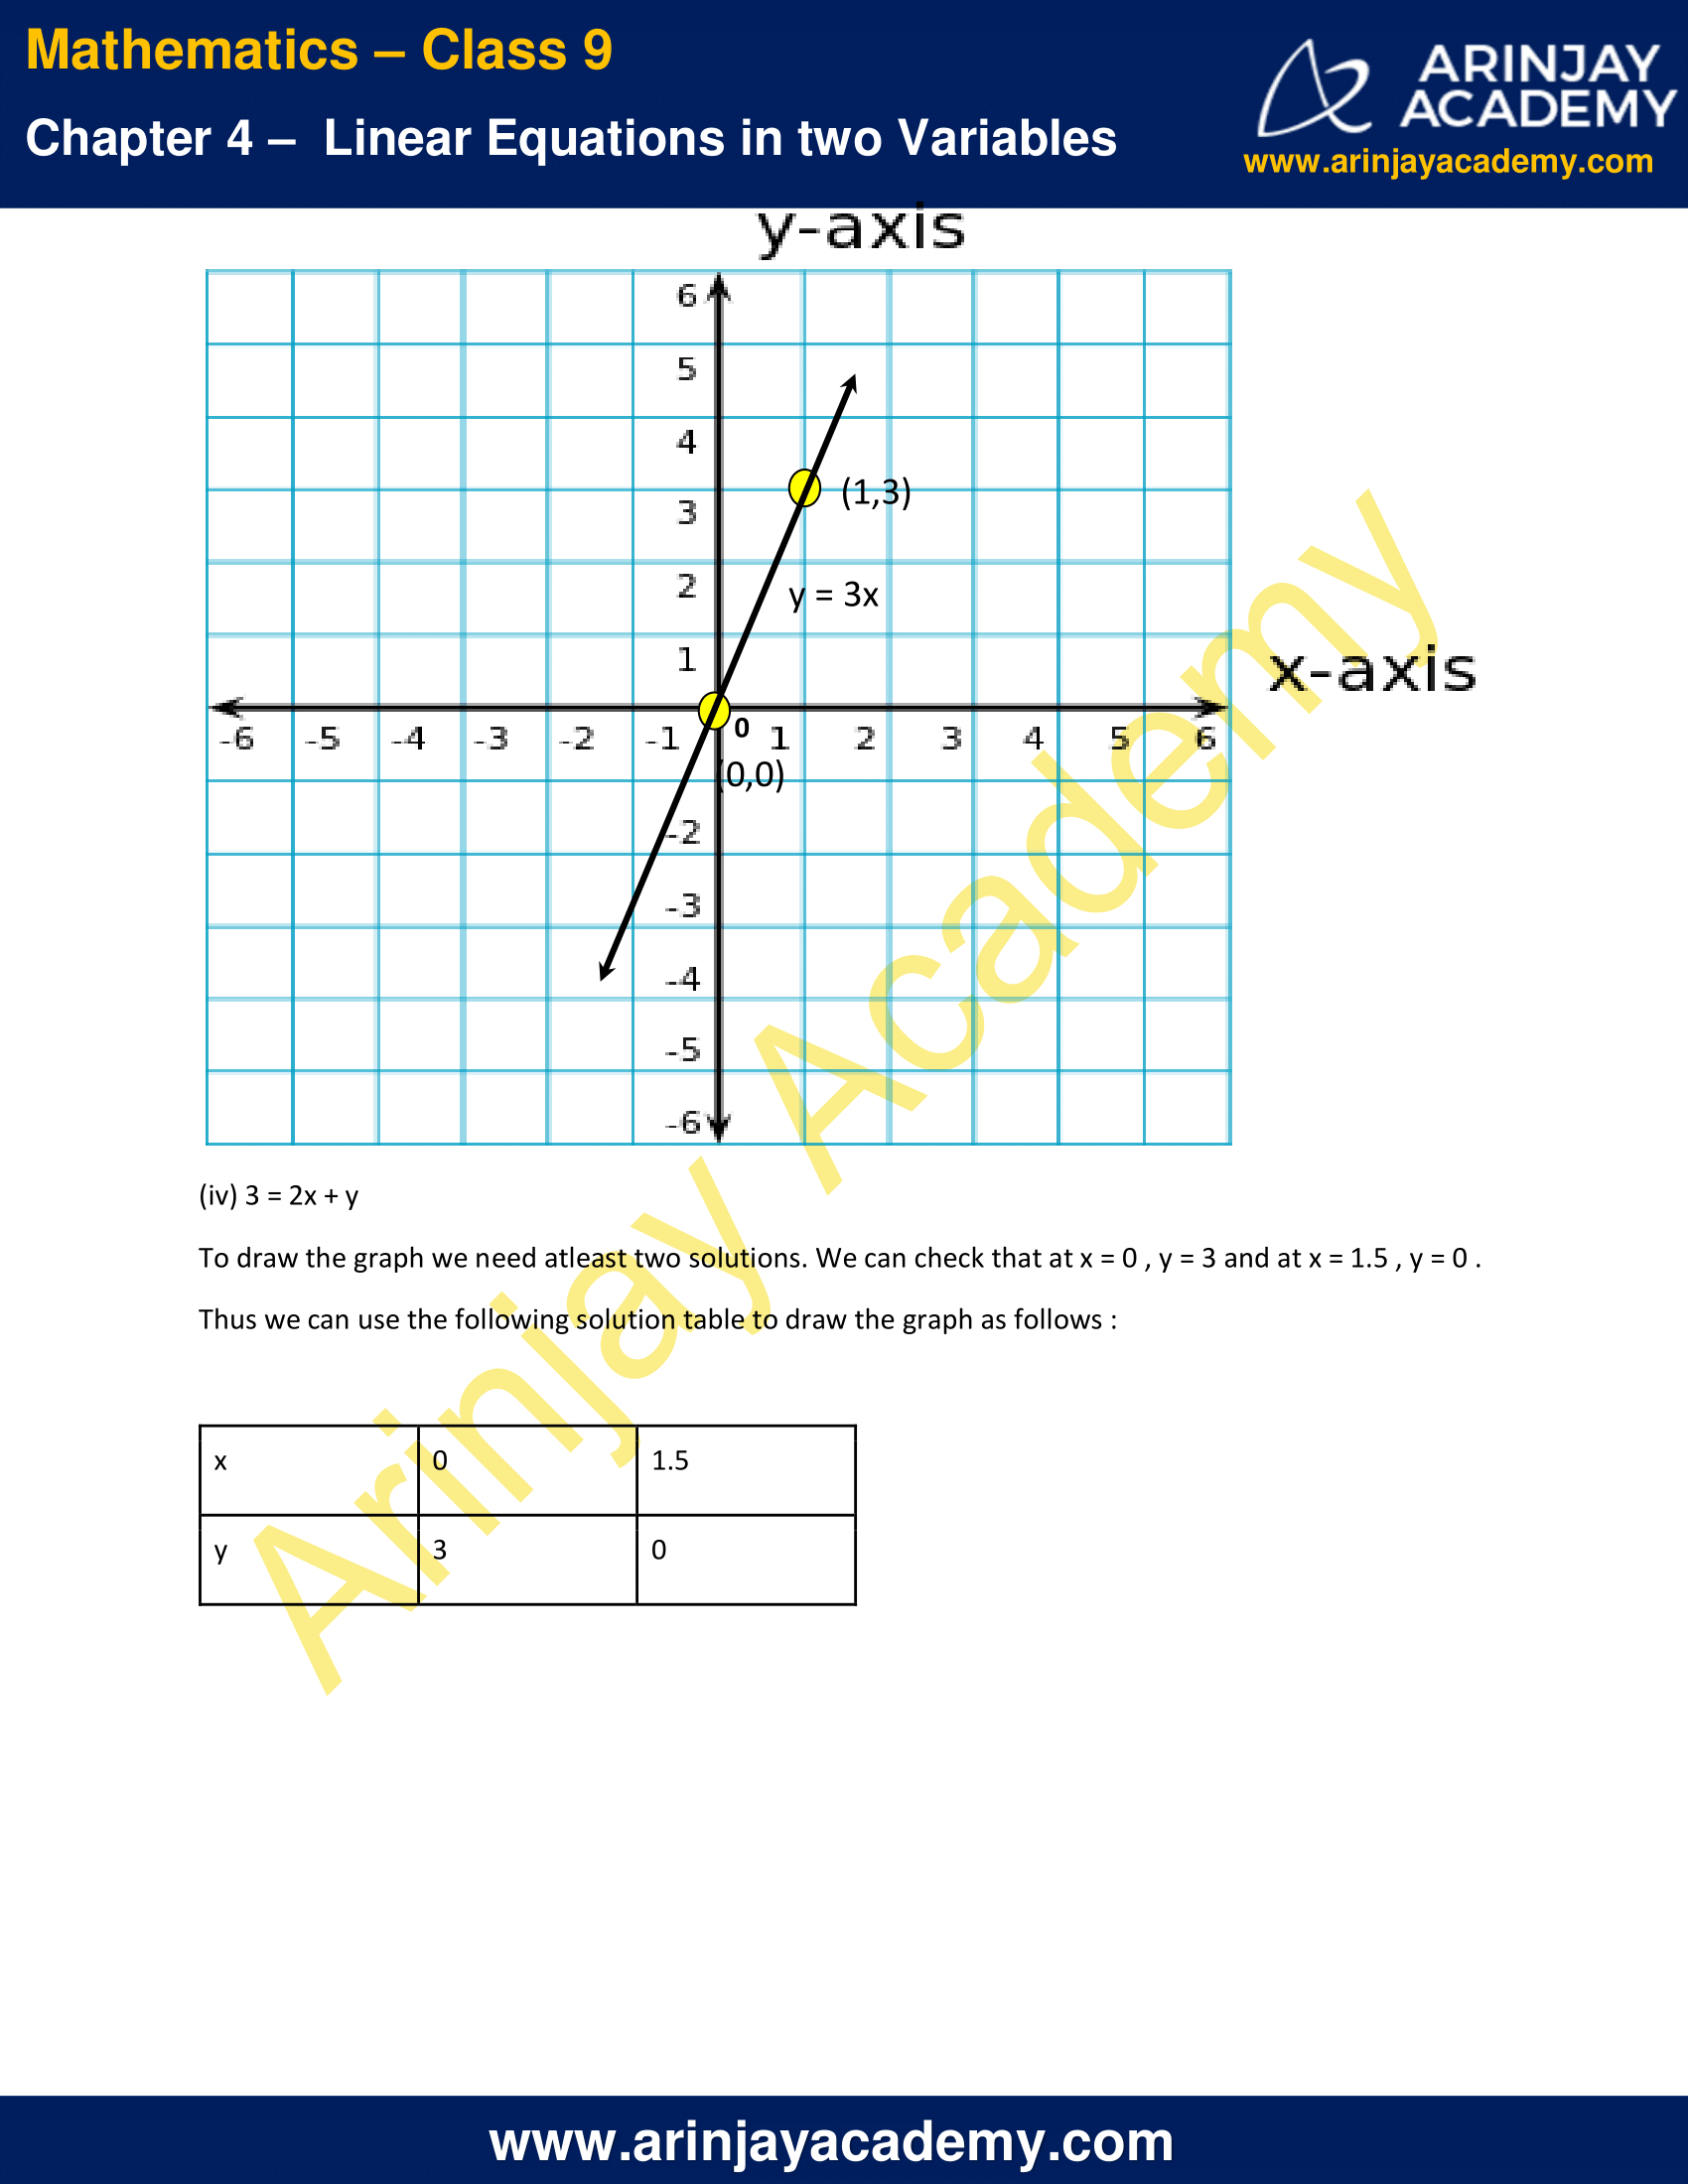
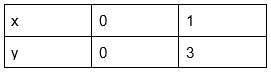
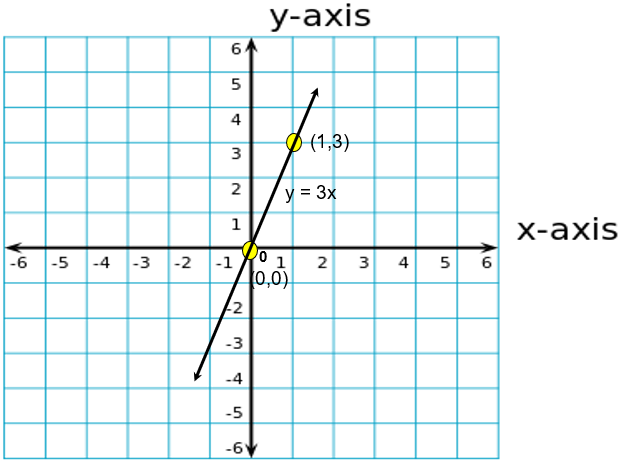
(iii) y = 3x
To draw the graph we need atleast two solutions. We can check that at x = 0 , y = 0 and at x = 1, y = 3 .
Thus we can use the following solution table to draw the graph as follows :
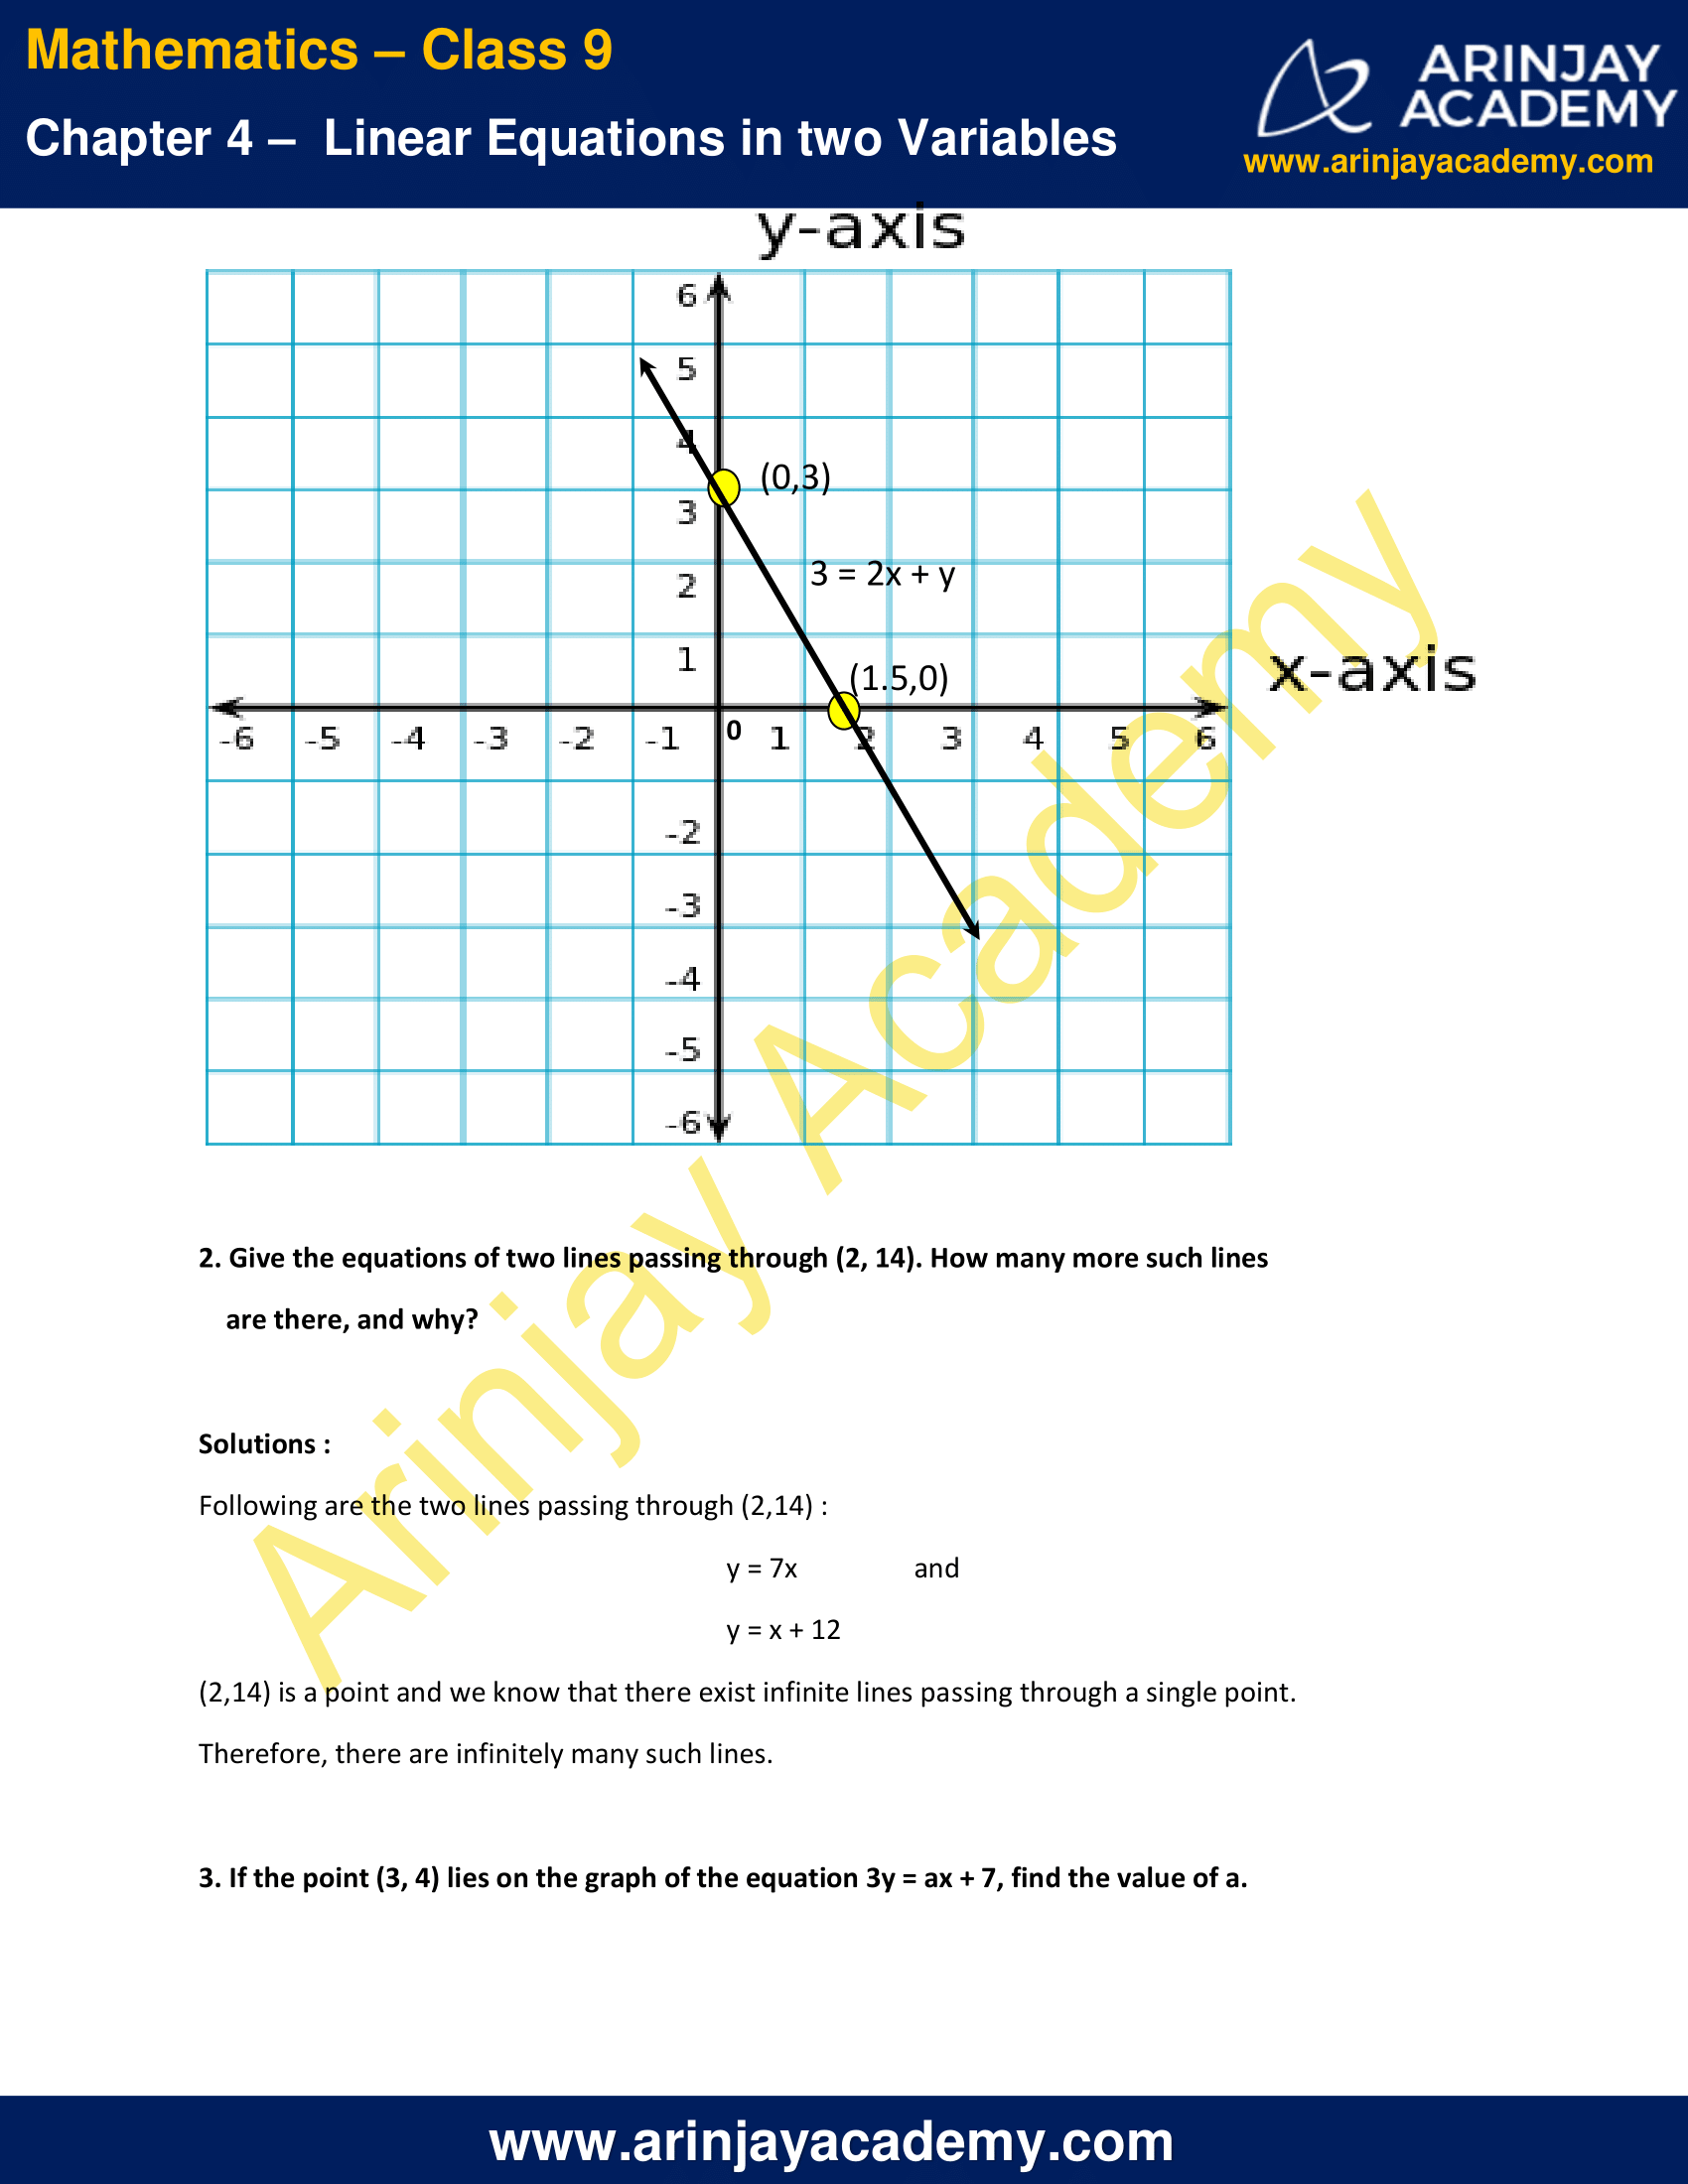
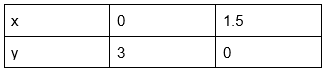
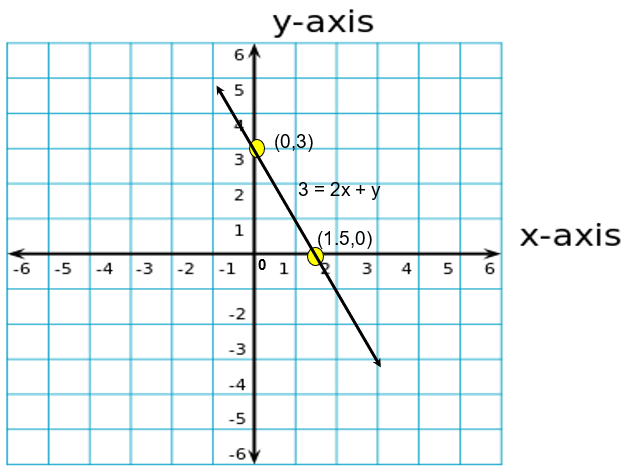
(iv) 3 = 2x + y
To draw the graph we need atleast two solutions. We can check that at x = 0 , y = 3 and at x = 1.5 , y = 0 .
Thus we can use the following solution table to draw the graph as follows :
2. Give the equations of two lines passing through (2, 14). How many more such lines are there, and why?
Solutions :
Following are the two lines passing through (2,14) :
y = 7x
y = x + 12
(2,14) is a point and we know that there exist infinite lines passing through a single point.
Therefore, there are infinitely many such lines.
3. If the point (3, 4) lies on the graph of the equation 3y = ax + 7, find the value of a.
Solution:
Given that the point lies on the graph of the given equation, this implies that the point satisfies the same equation.
Therefore, (3,4) must satisfy the equation 3y = ax + 7
Putting x = 3 and y = 4 in the equation we get,
3(4) = a(3) + 7
3a = 5
a = 5/3
4. The taxi fare in a city is as follows: For the first kilometre, the fare is Rs 8 and for the subsequent distance it is Rs 5 per km. Taking the distance covered as x km and total fare as Rs y, write a linear equation for this information, and draw its graph.
Solution :
Total distance covered = x km
Fare for 1 st kilometre = Rs 8
Fare for the subsequent distance = Rs (x − 1) 5
Total fare(y) = Rs [8 + (x − 1) 5]
y = 8 + 5x − 5
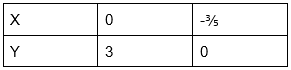
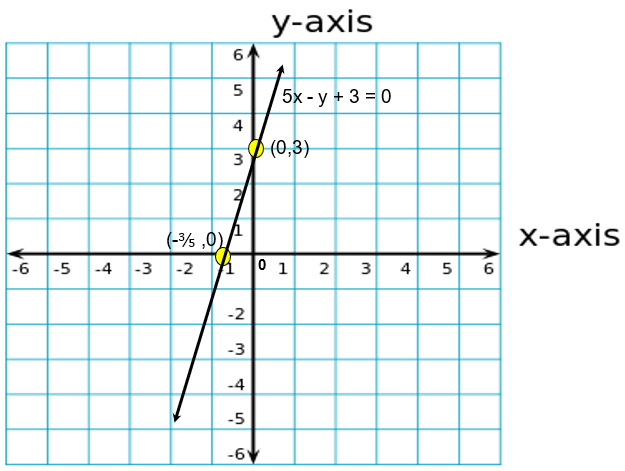
y = 5x + 3
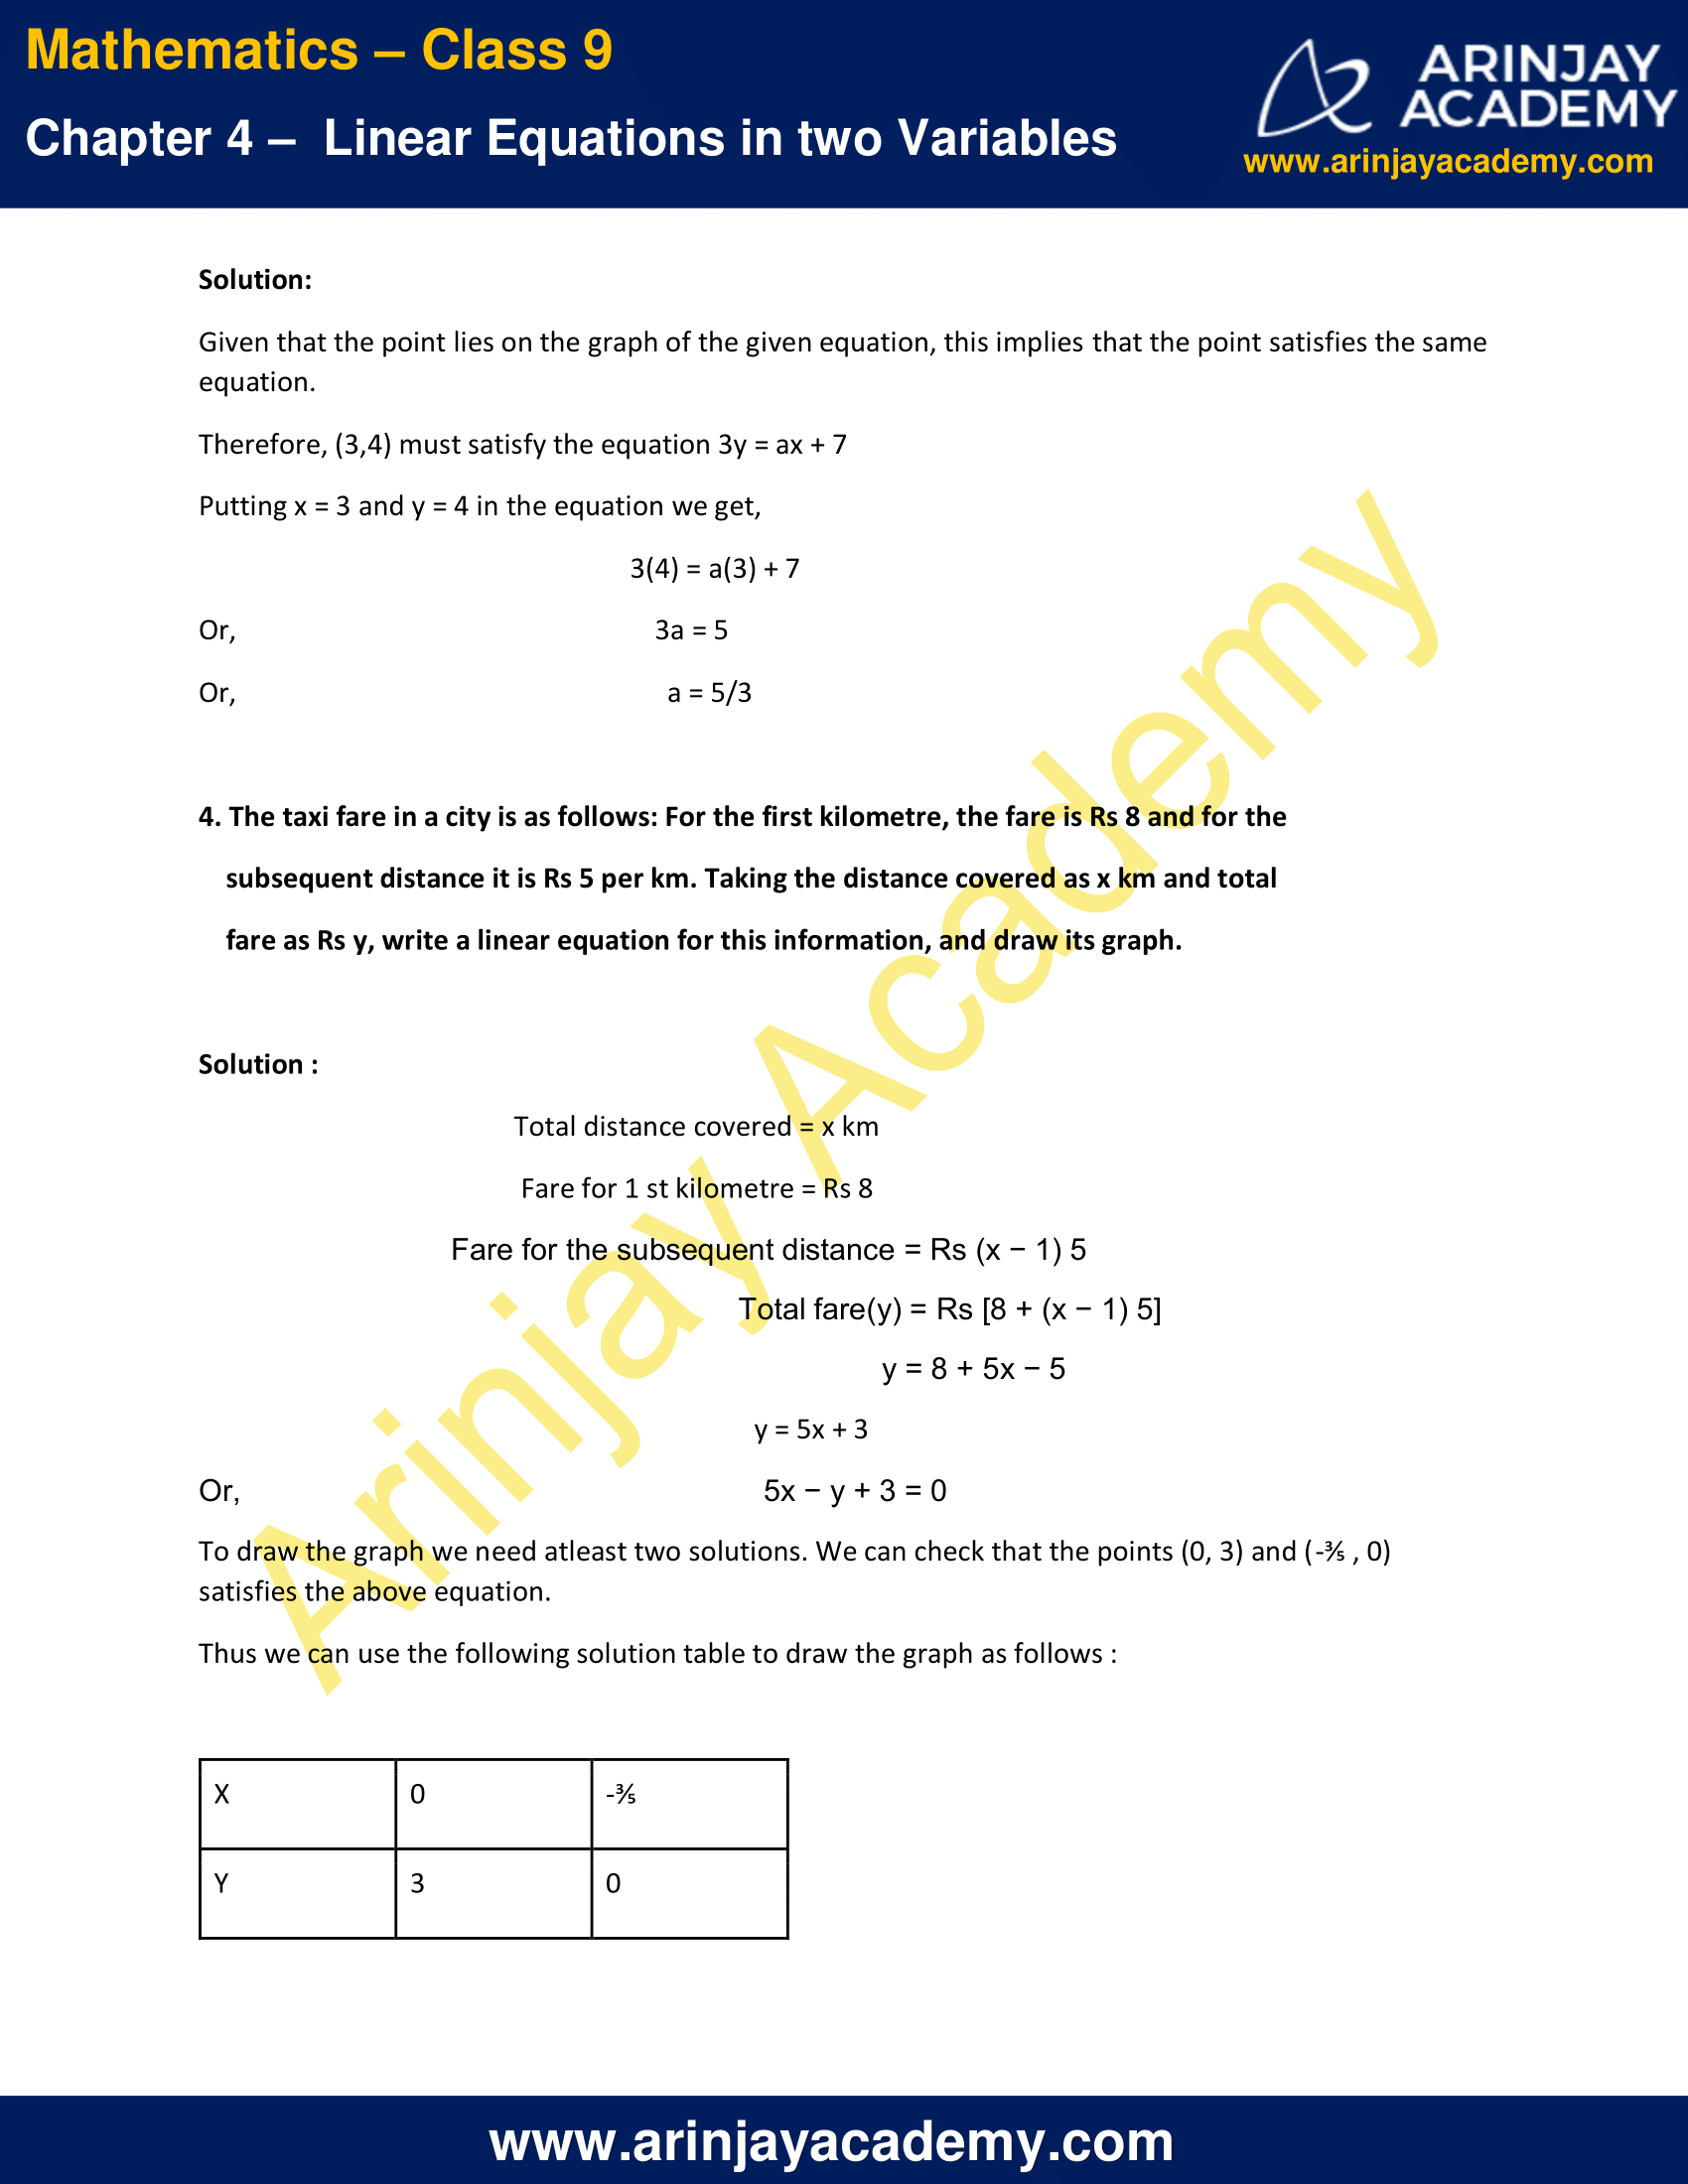
5x − y + 3 = 0
To draw the graph we need atleast two solutions. We can check that the points (0, 3) and (-⅗ , 0) satisfies the above equation.
Thus we can use the following solution table to draw the graph as follows :
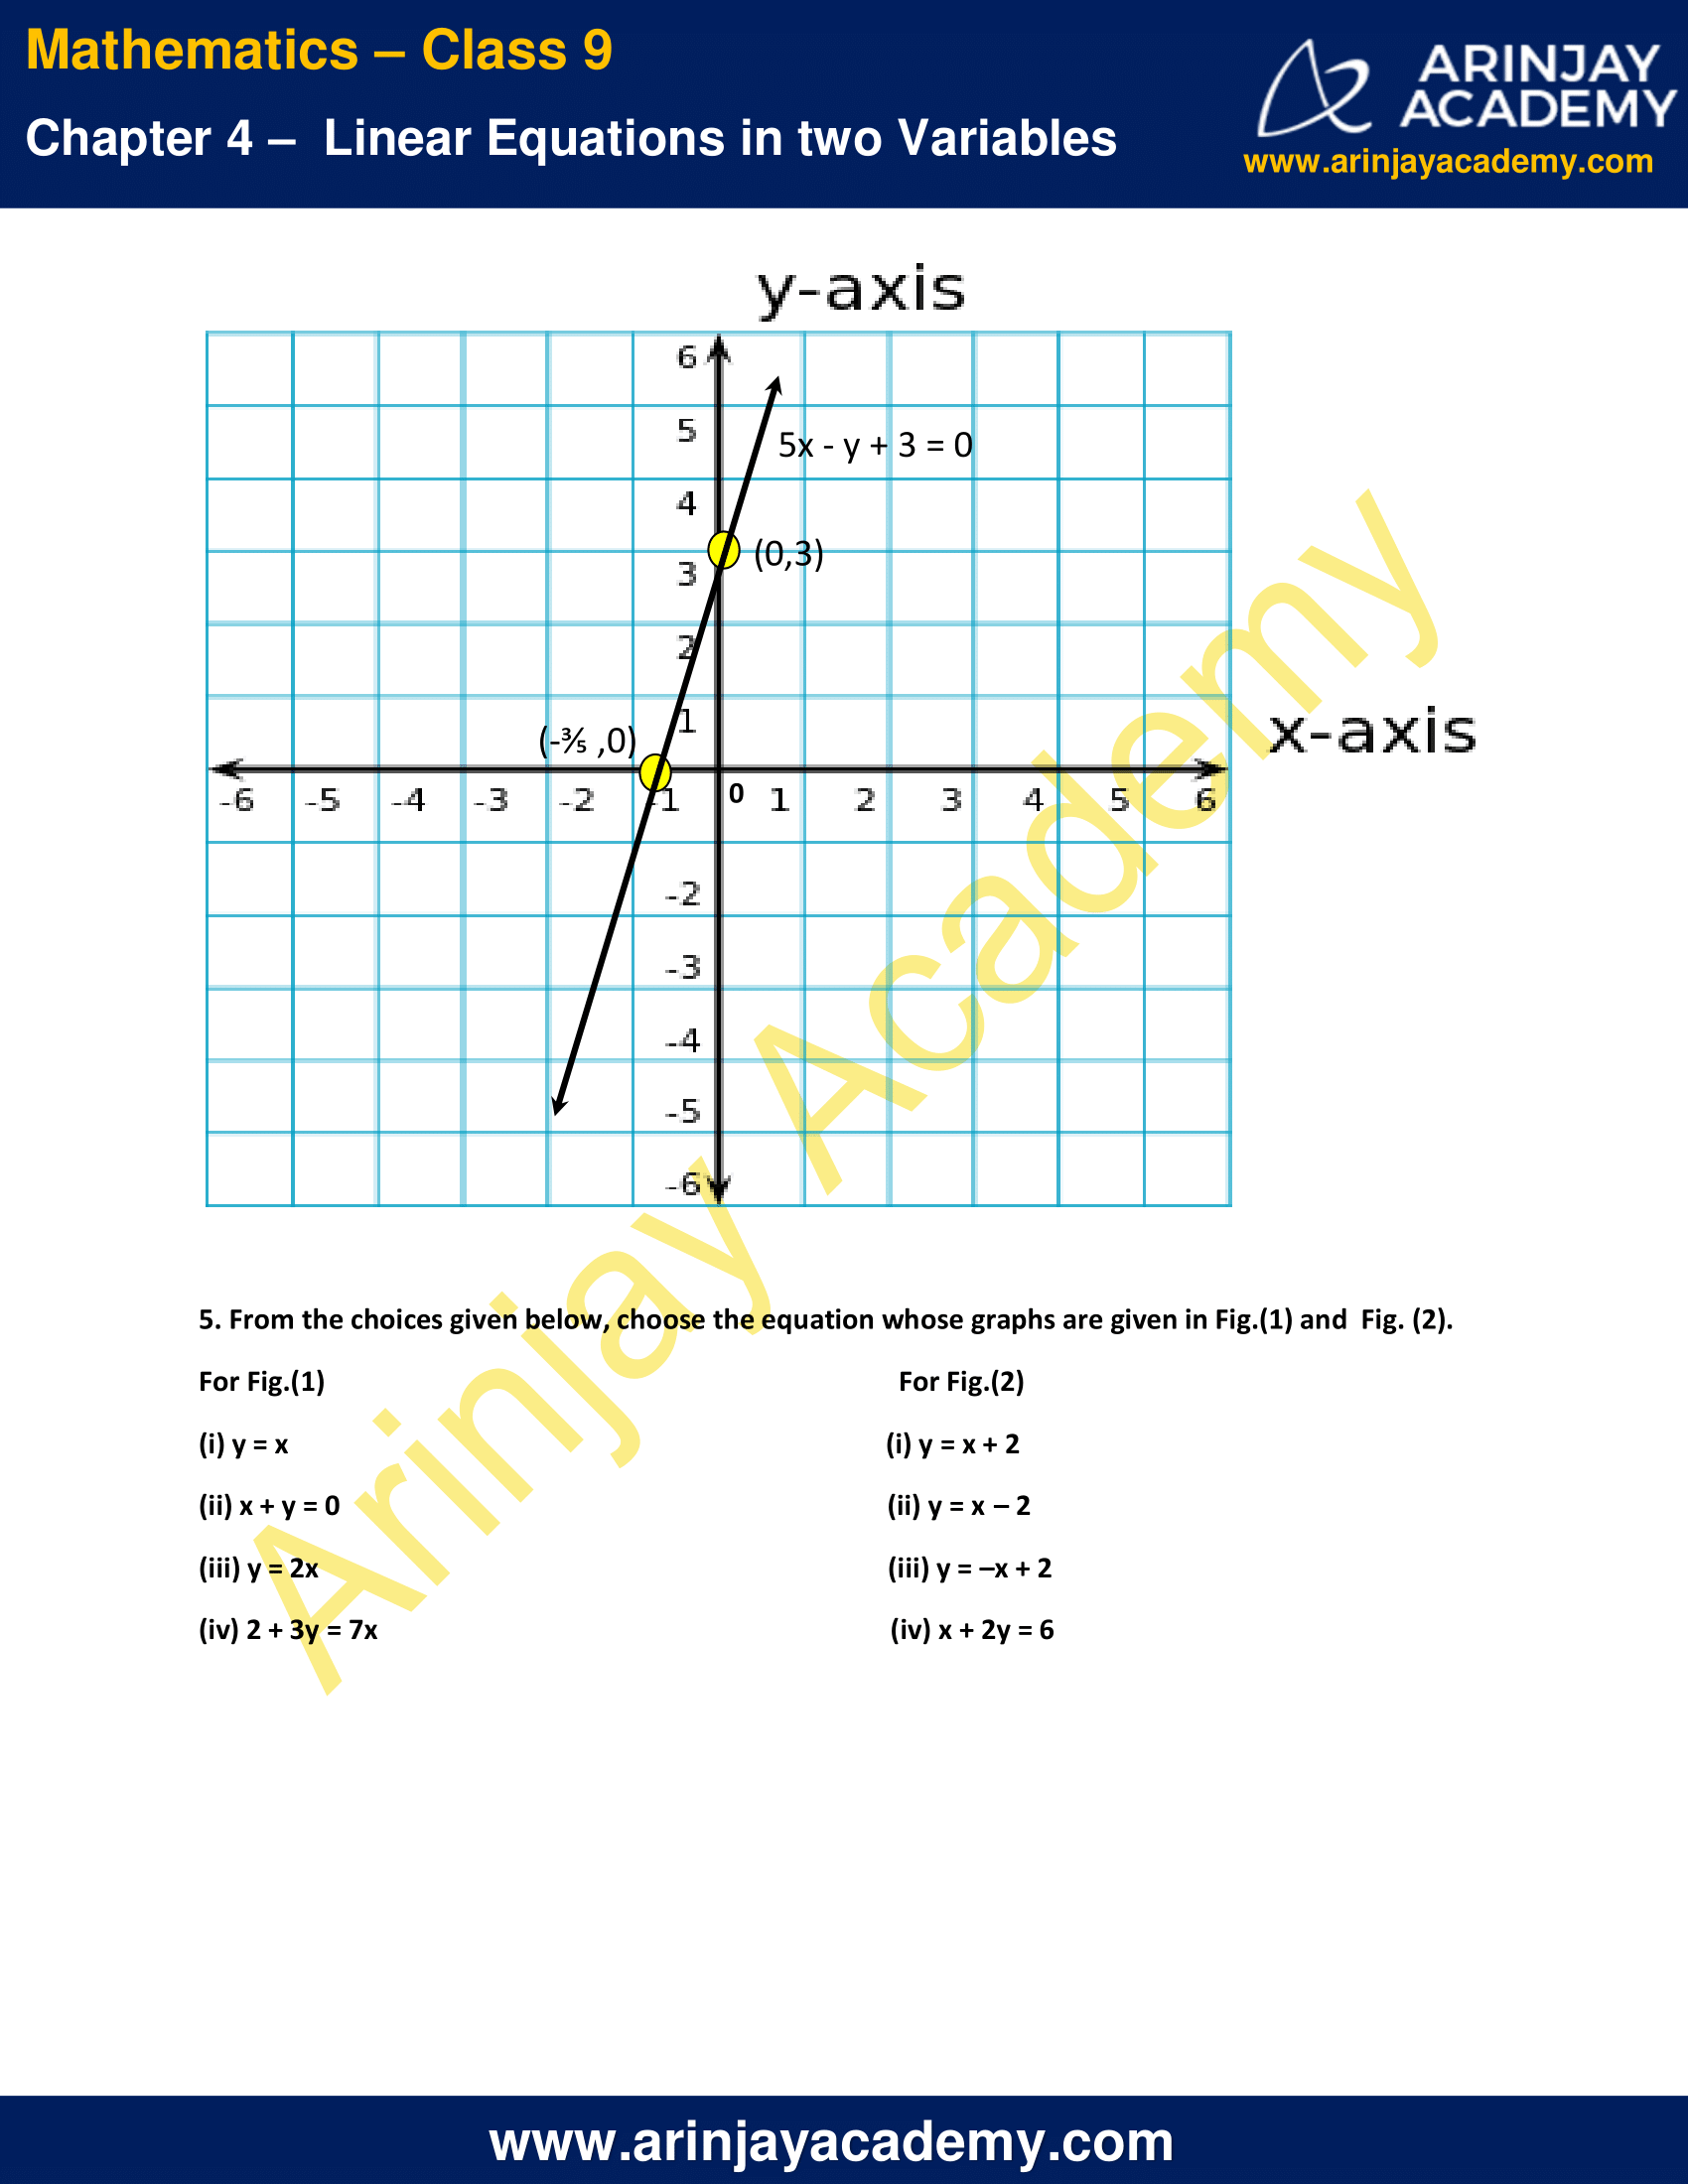
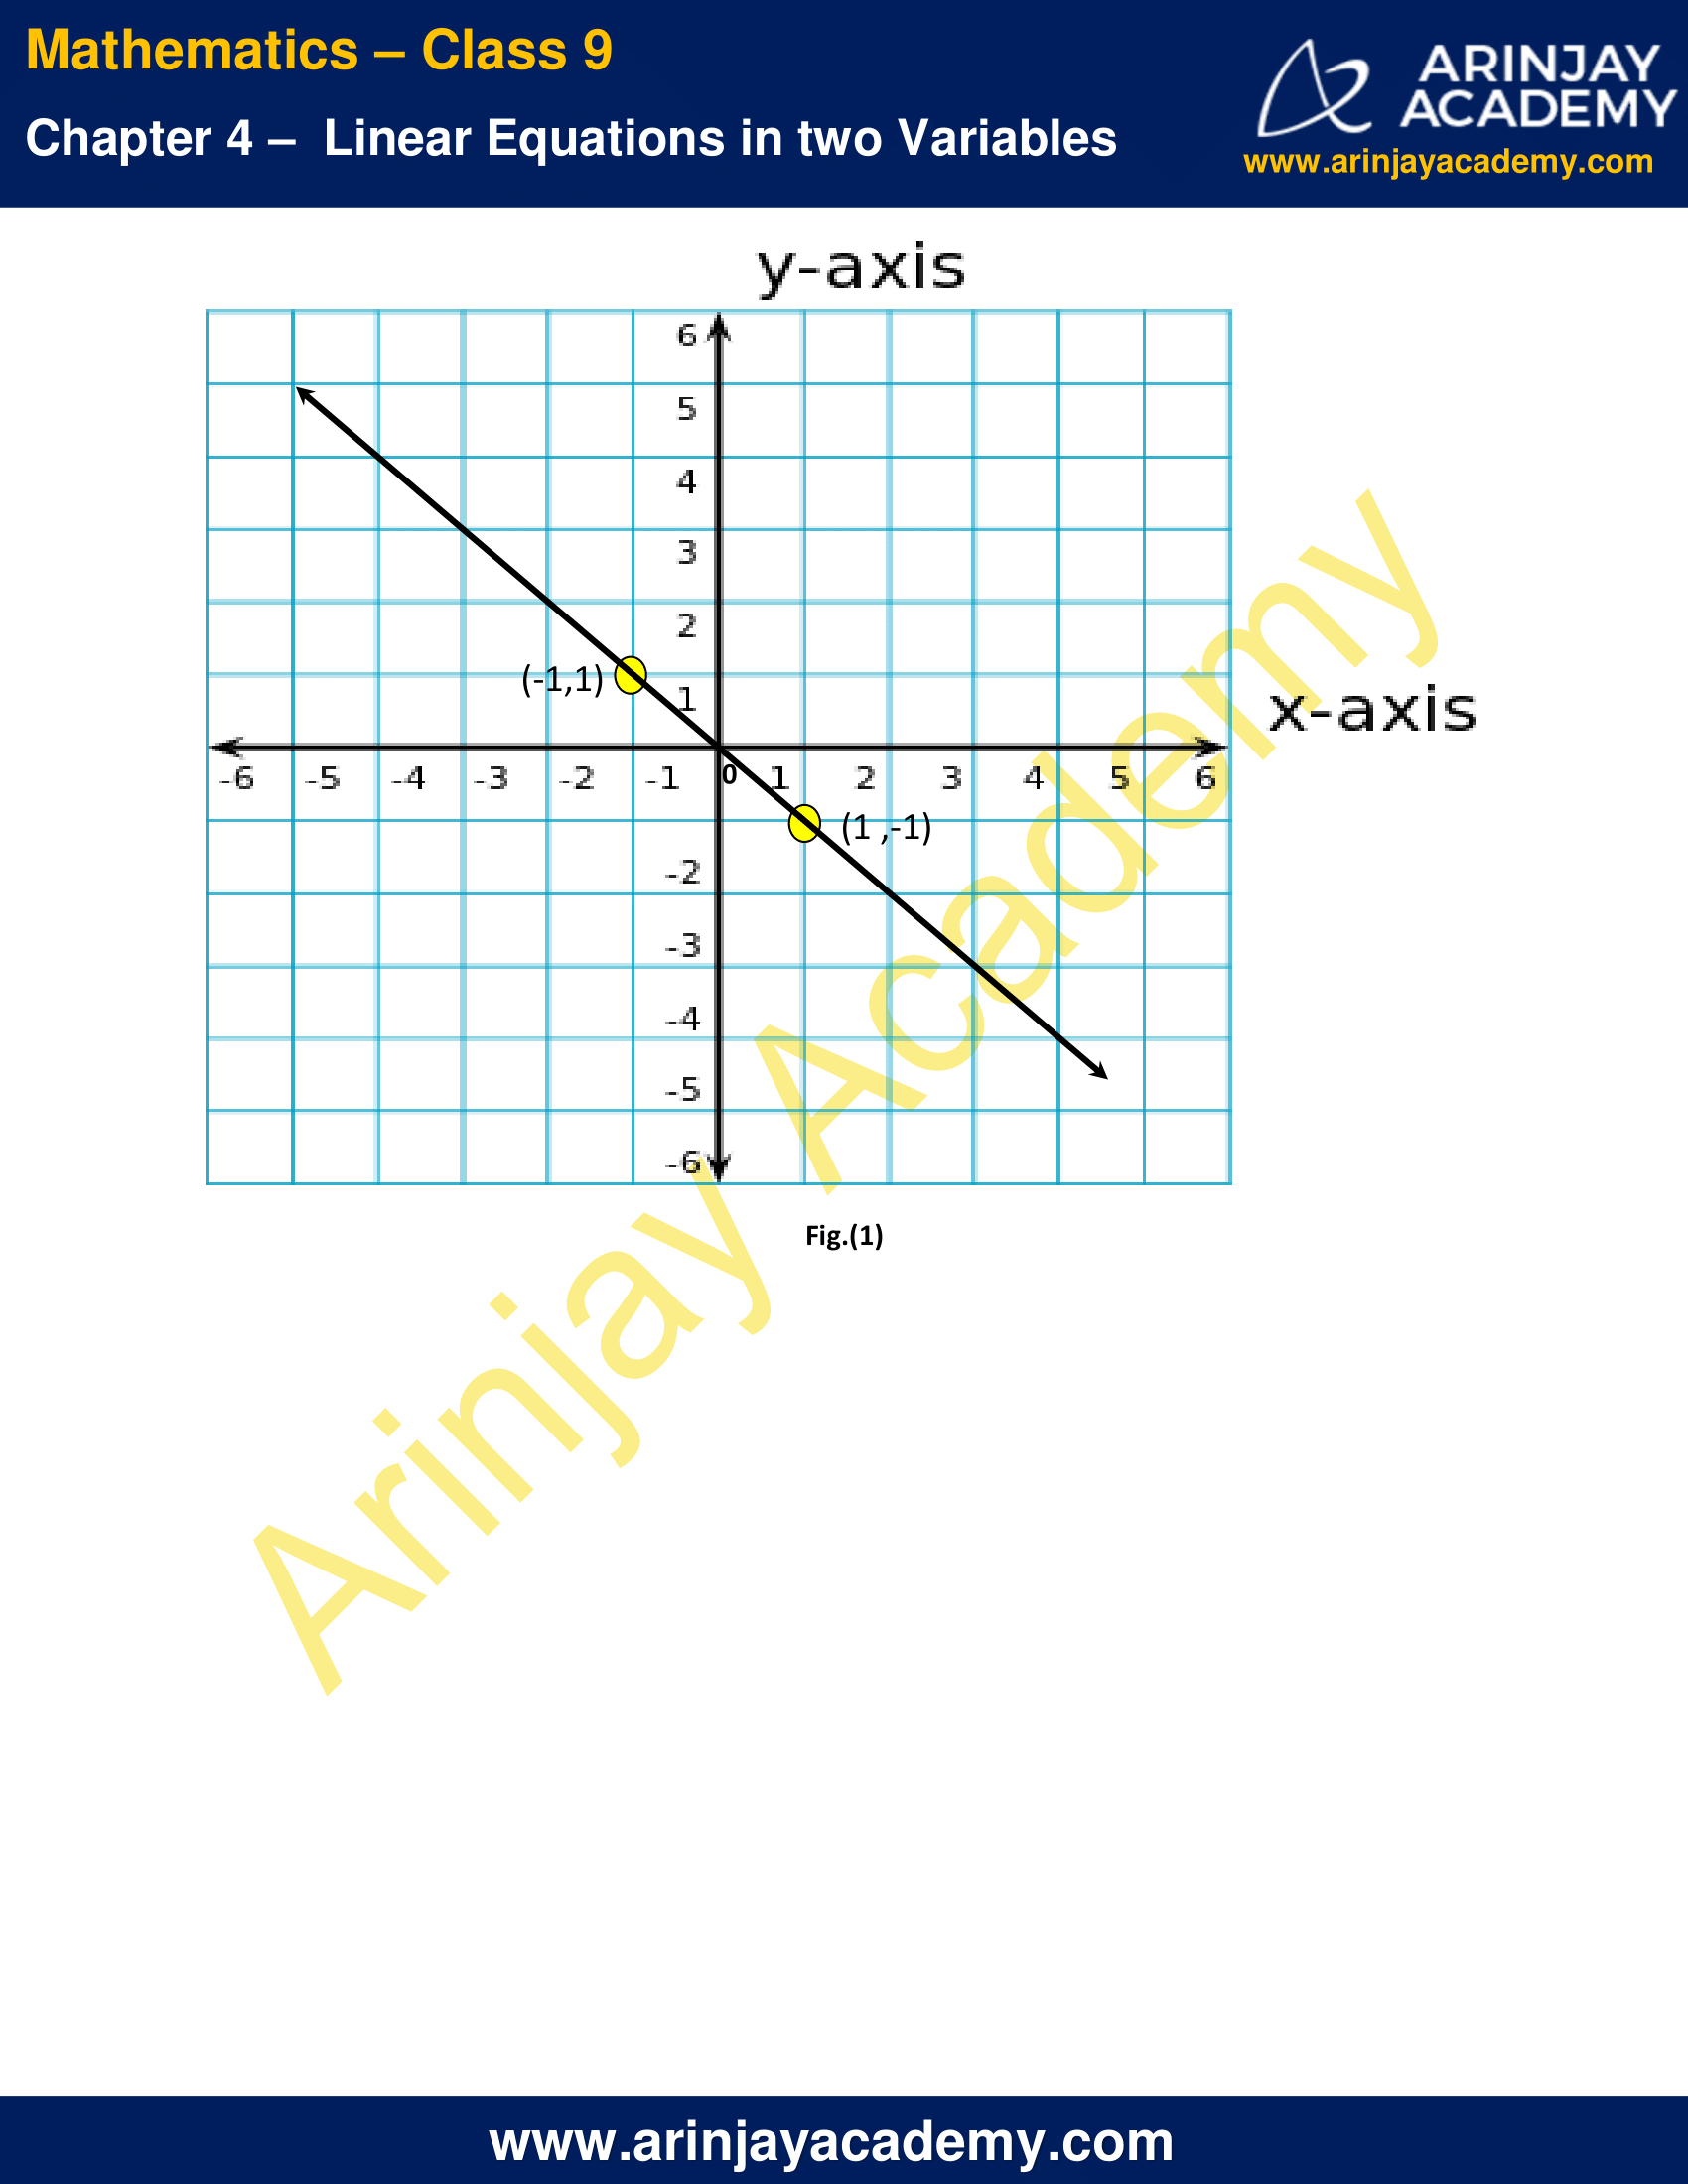
5. From the choices given below, choose the equation whose graphs are given in Fig.(1) and Fig. (2).
For Fig.(1)
(i) y = x
(ii) x + y = 0
(iii) y = 2x
(iv) 2 + 3y = 7x
For Fig.(2)
(i) y = x + 2
(ii) y = x – 2
(iii) y = –x + 2
(iv) x + 2y = 6
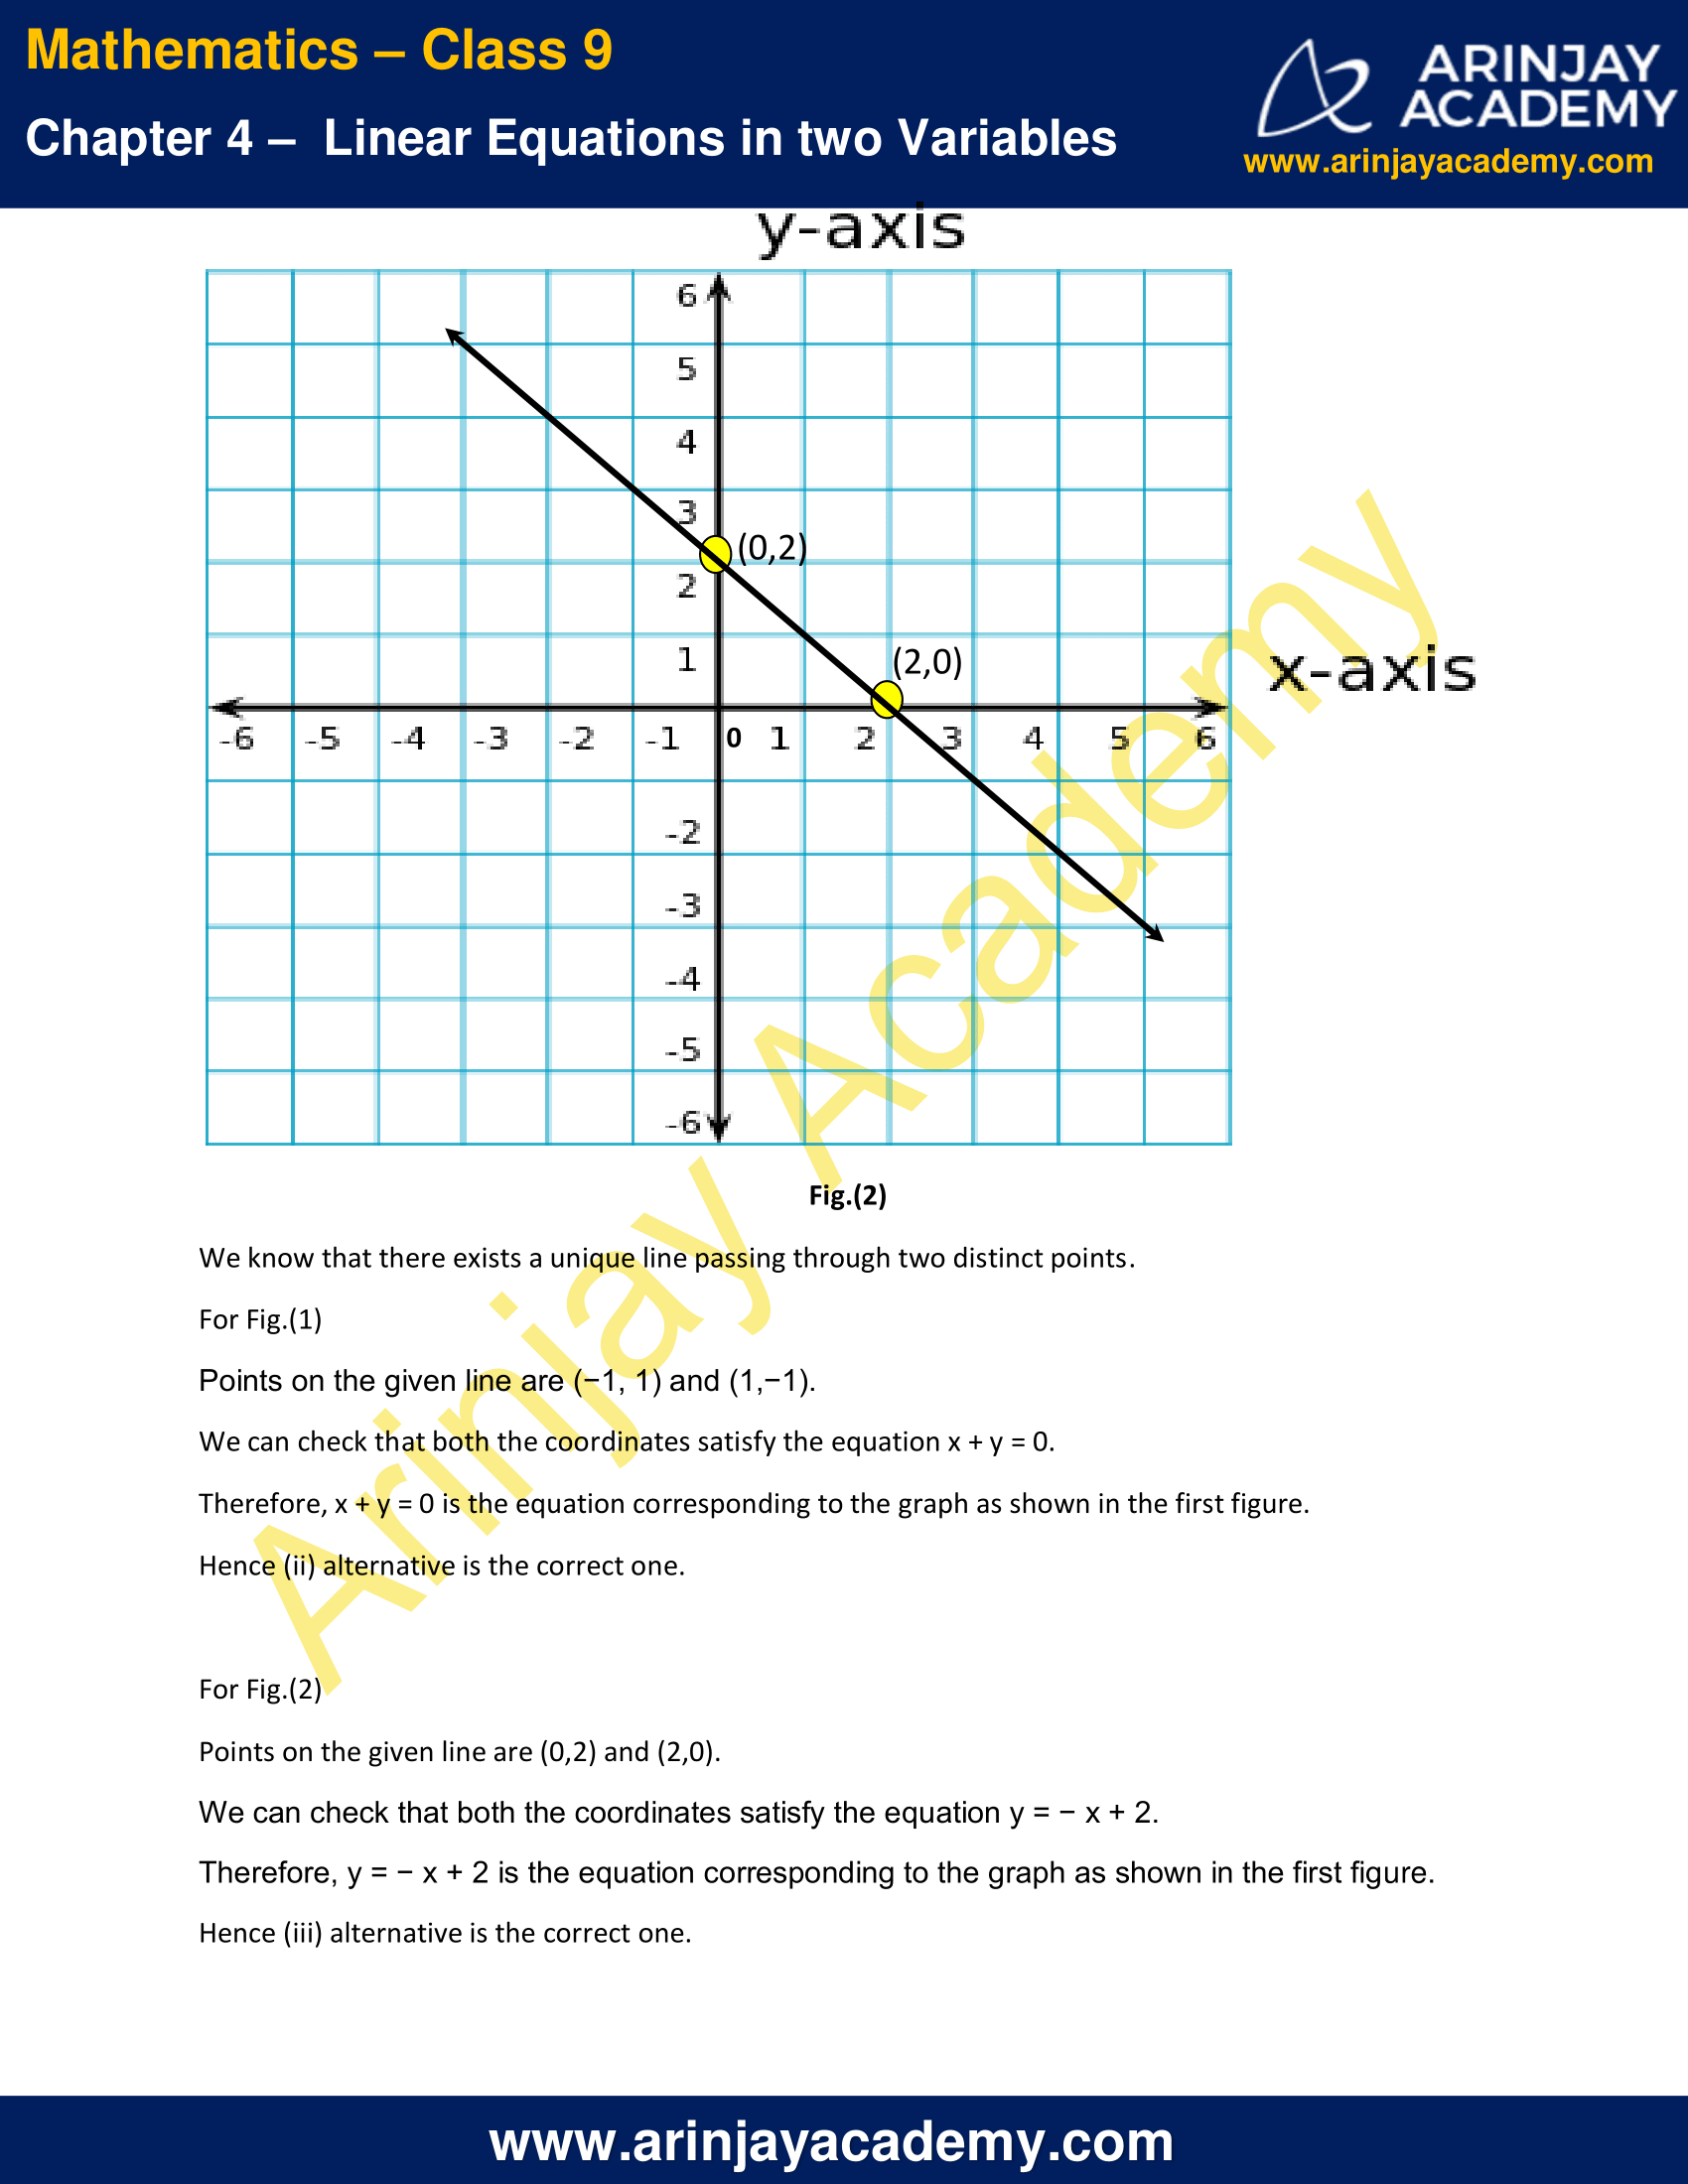
We know that there exists a unique line passing through two distinct points.
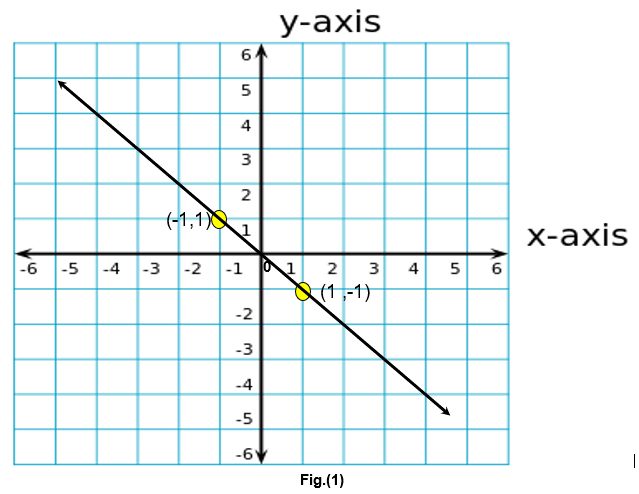
For Fig.(1)
Points on the given line are (−1, 1) and (1,−1).
We can check that both the coordinates satisfy the equation x + y = 0.
Therefore, x + y = 0 is the equation corresponding to the graph as shown in the first figure.
Hence (ii) alternative is the correct one.
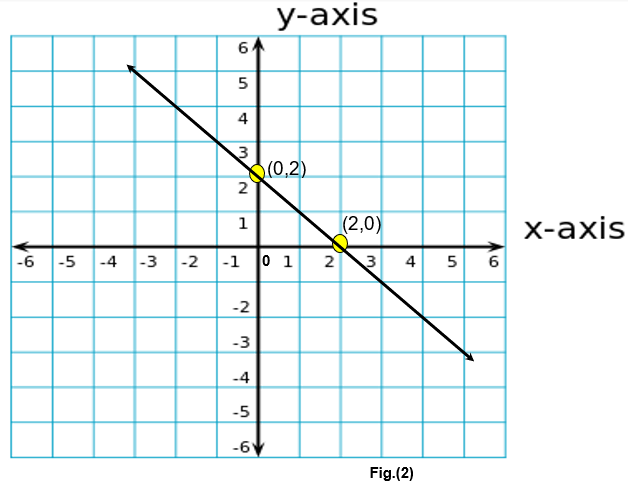
For Fig.(2)
Points on the given line are (0,2) and (2,0).
We can check that both the coordinates satisfy the equation y = − x + 2.
Therefore, y = − x + 2 is the equation corresponding to the graph as shown in the first figure.
Hence (iii) alternative is the correct one.
6. If the work done by a body on application of a constant force is directly proportional to the distance travelled by the body, express this in the form of an equation in two variables and draw the graph of the same by taking the constant force as 5 units. Also read from the graph the work done when the distance travelled by the body is
(i) 2 units
(ii) 0 unit
Solution :
Let the distance travelled and the work done by the body be x and y respectively.
It is given that the work done is directly proportional to the distance travelled
i.e. y ∝ x
y = kx
Where, k = constant force
If constant force is 5 units, then work done is given as,
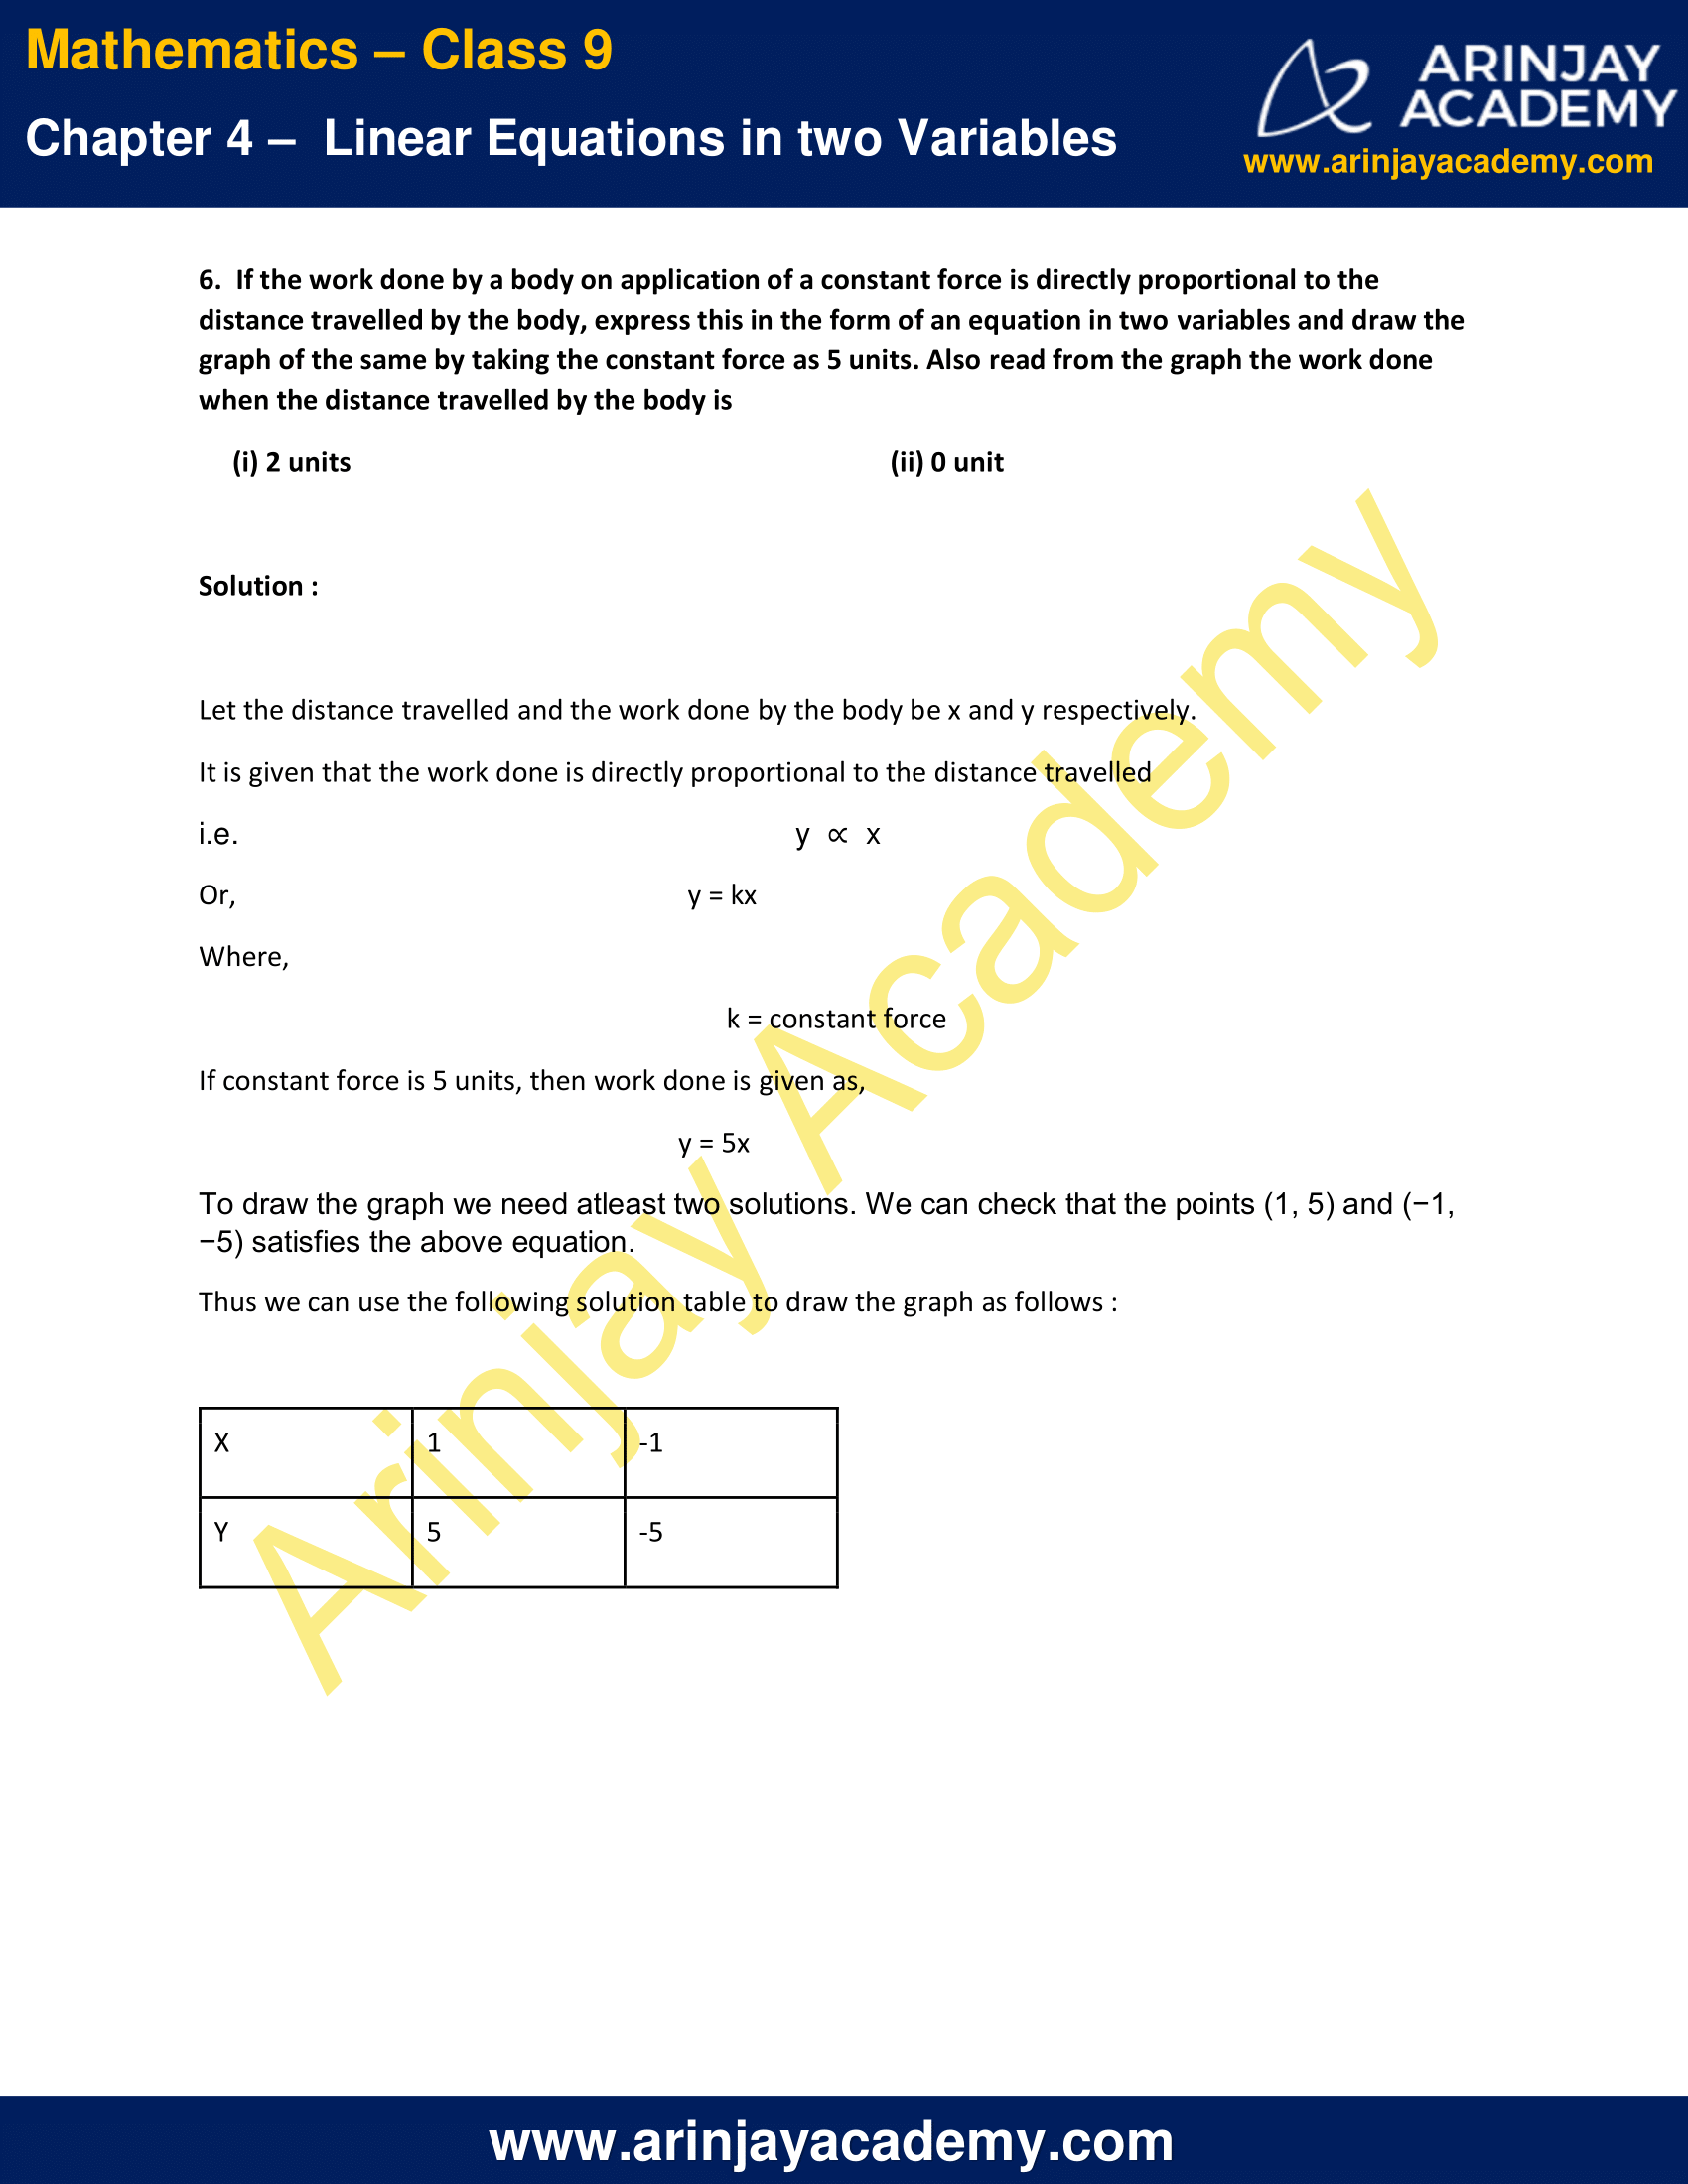
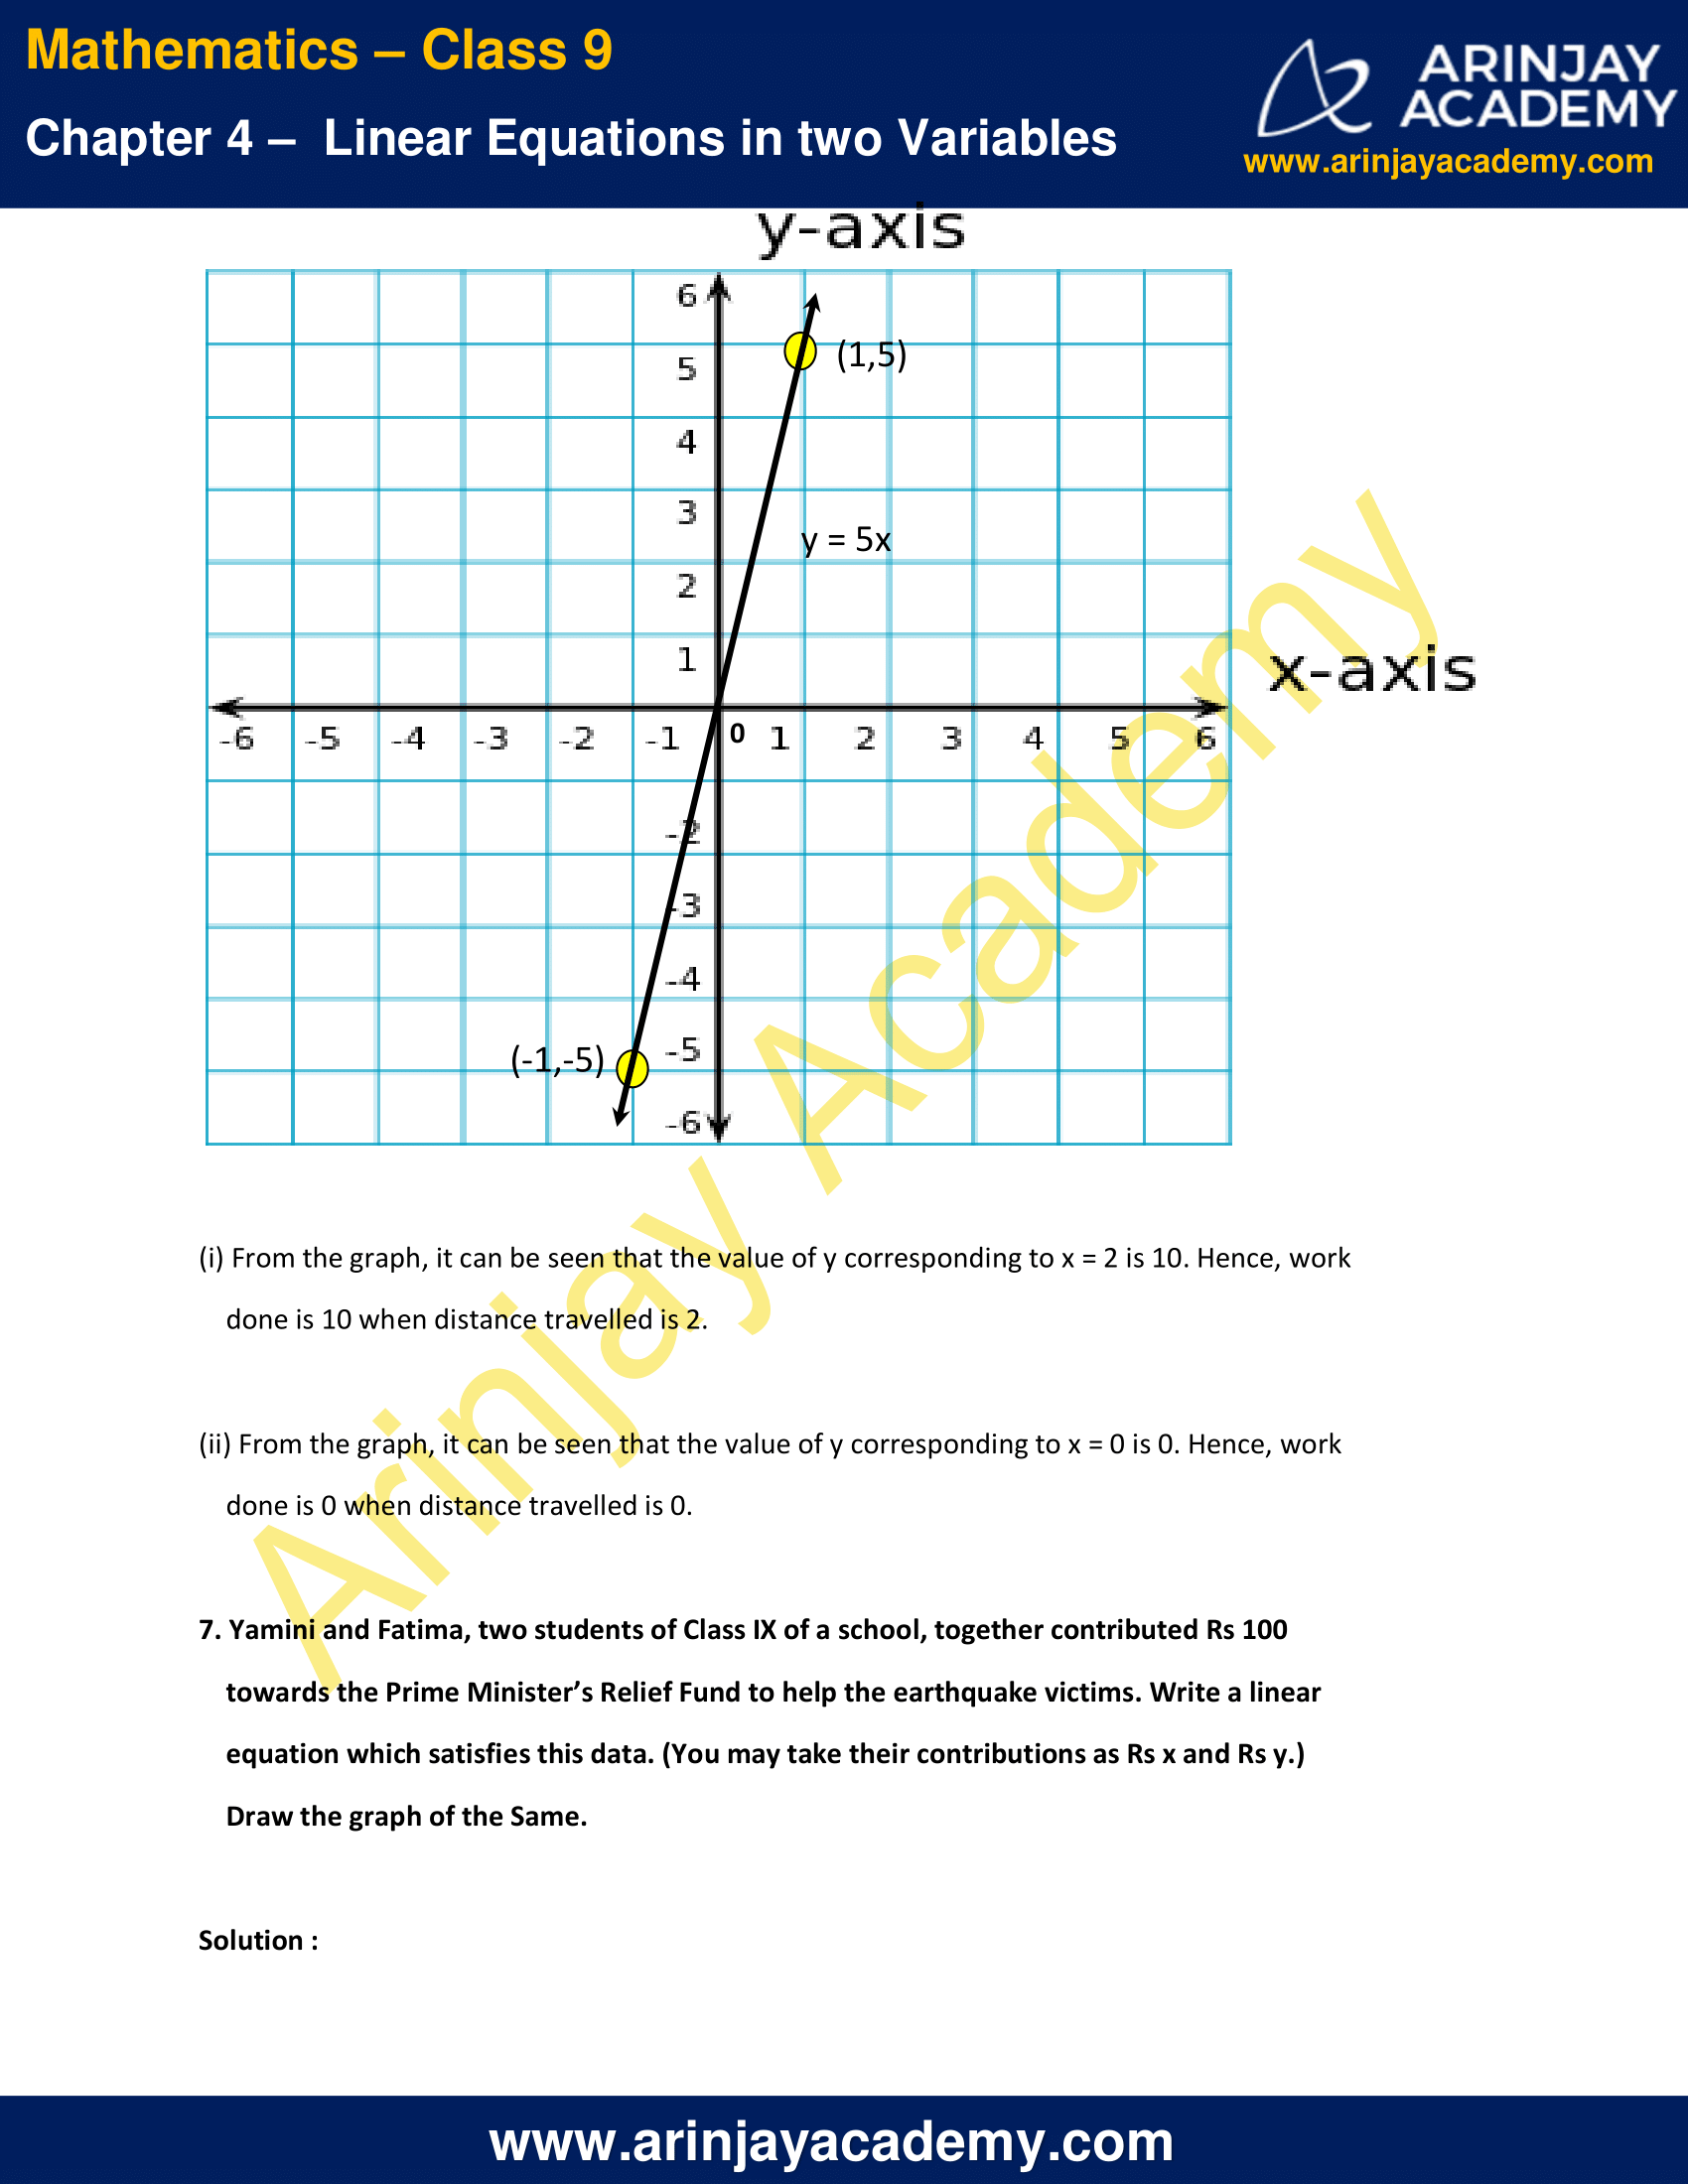
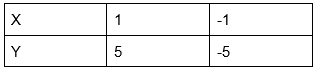
y = 5x
To draw the graph we need atleast two solutions. We can check that the points (1, 5) and (−1, −5) satisfies the above equation.
Thus we can use the following solution table to draw the graph as follows :
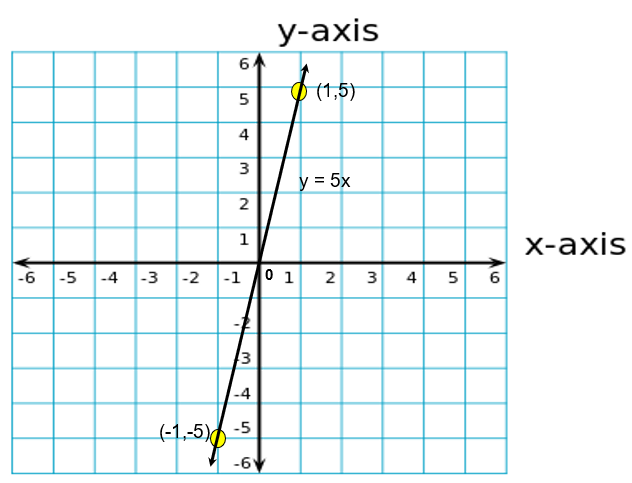
(i) From the graph, it can be seen that the value of y corresponding to x = 2 is 10. Hence, work done is 10 when distance travelled is 2.
(ii) From the graph, it can be seen that the value of y corresponding to x = 0 is 0. Hence, work done is 0 when distance travelled is 0.
7. Yamini and Fatima, two students of Class IX of a school, together contributed Rs 100 towards the Prime Minister’s Relief Fund to help the earthquake victims. Write a linear equation which satisfies this data. (You may take their contributions as Rs x and Rs y.) Draw the graph of the Same.
Solution :
Let the amount that Yamini and Fatima contributed be x and y respectively towards the Prime Minister’s Relief fund.
Amount contributed by Yamini + Amount contributed by Fatima = 100
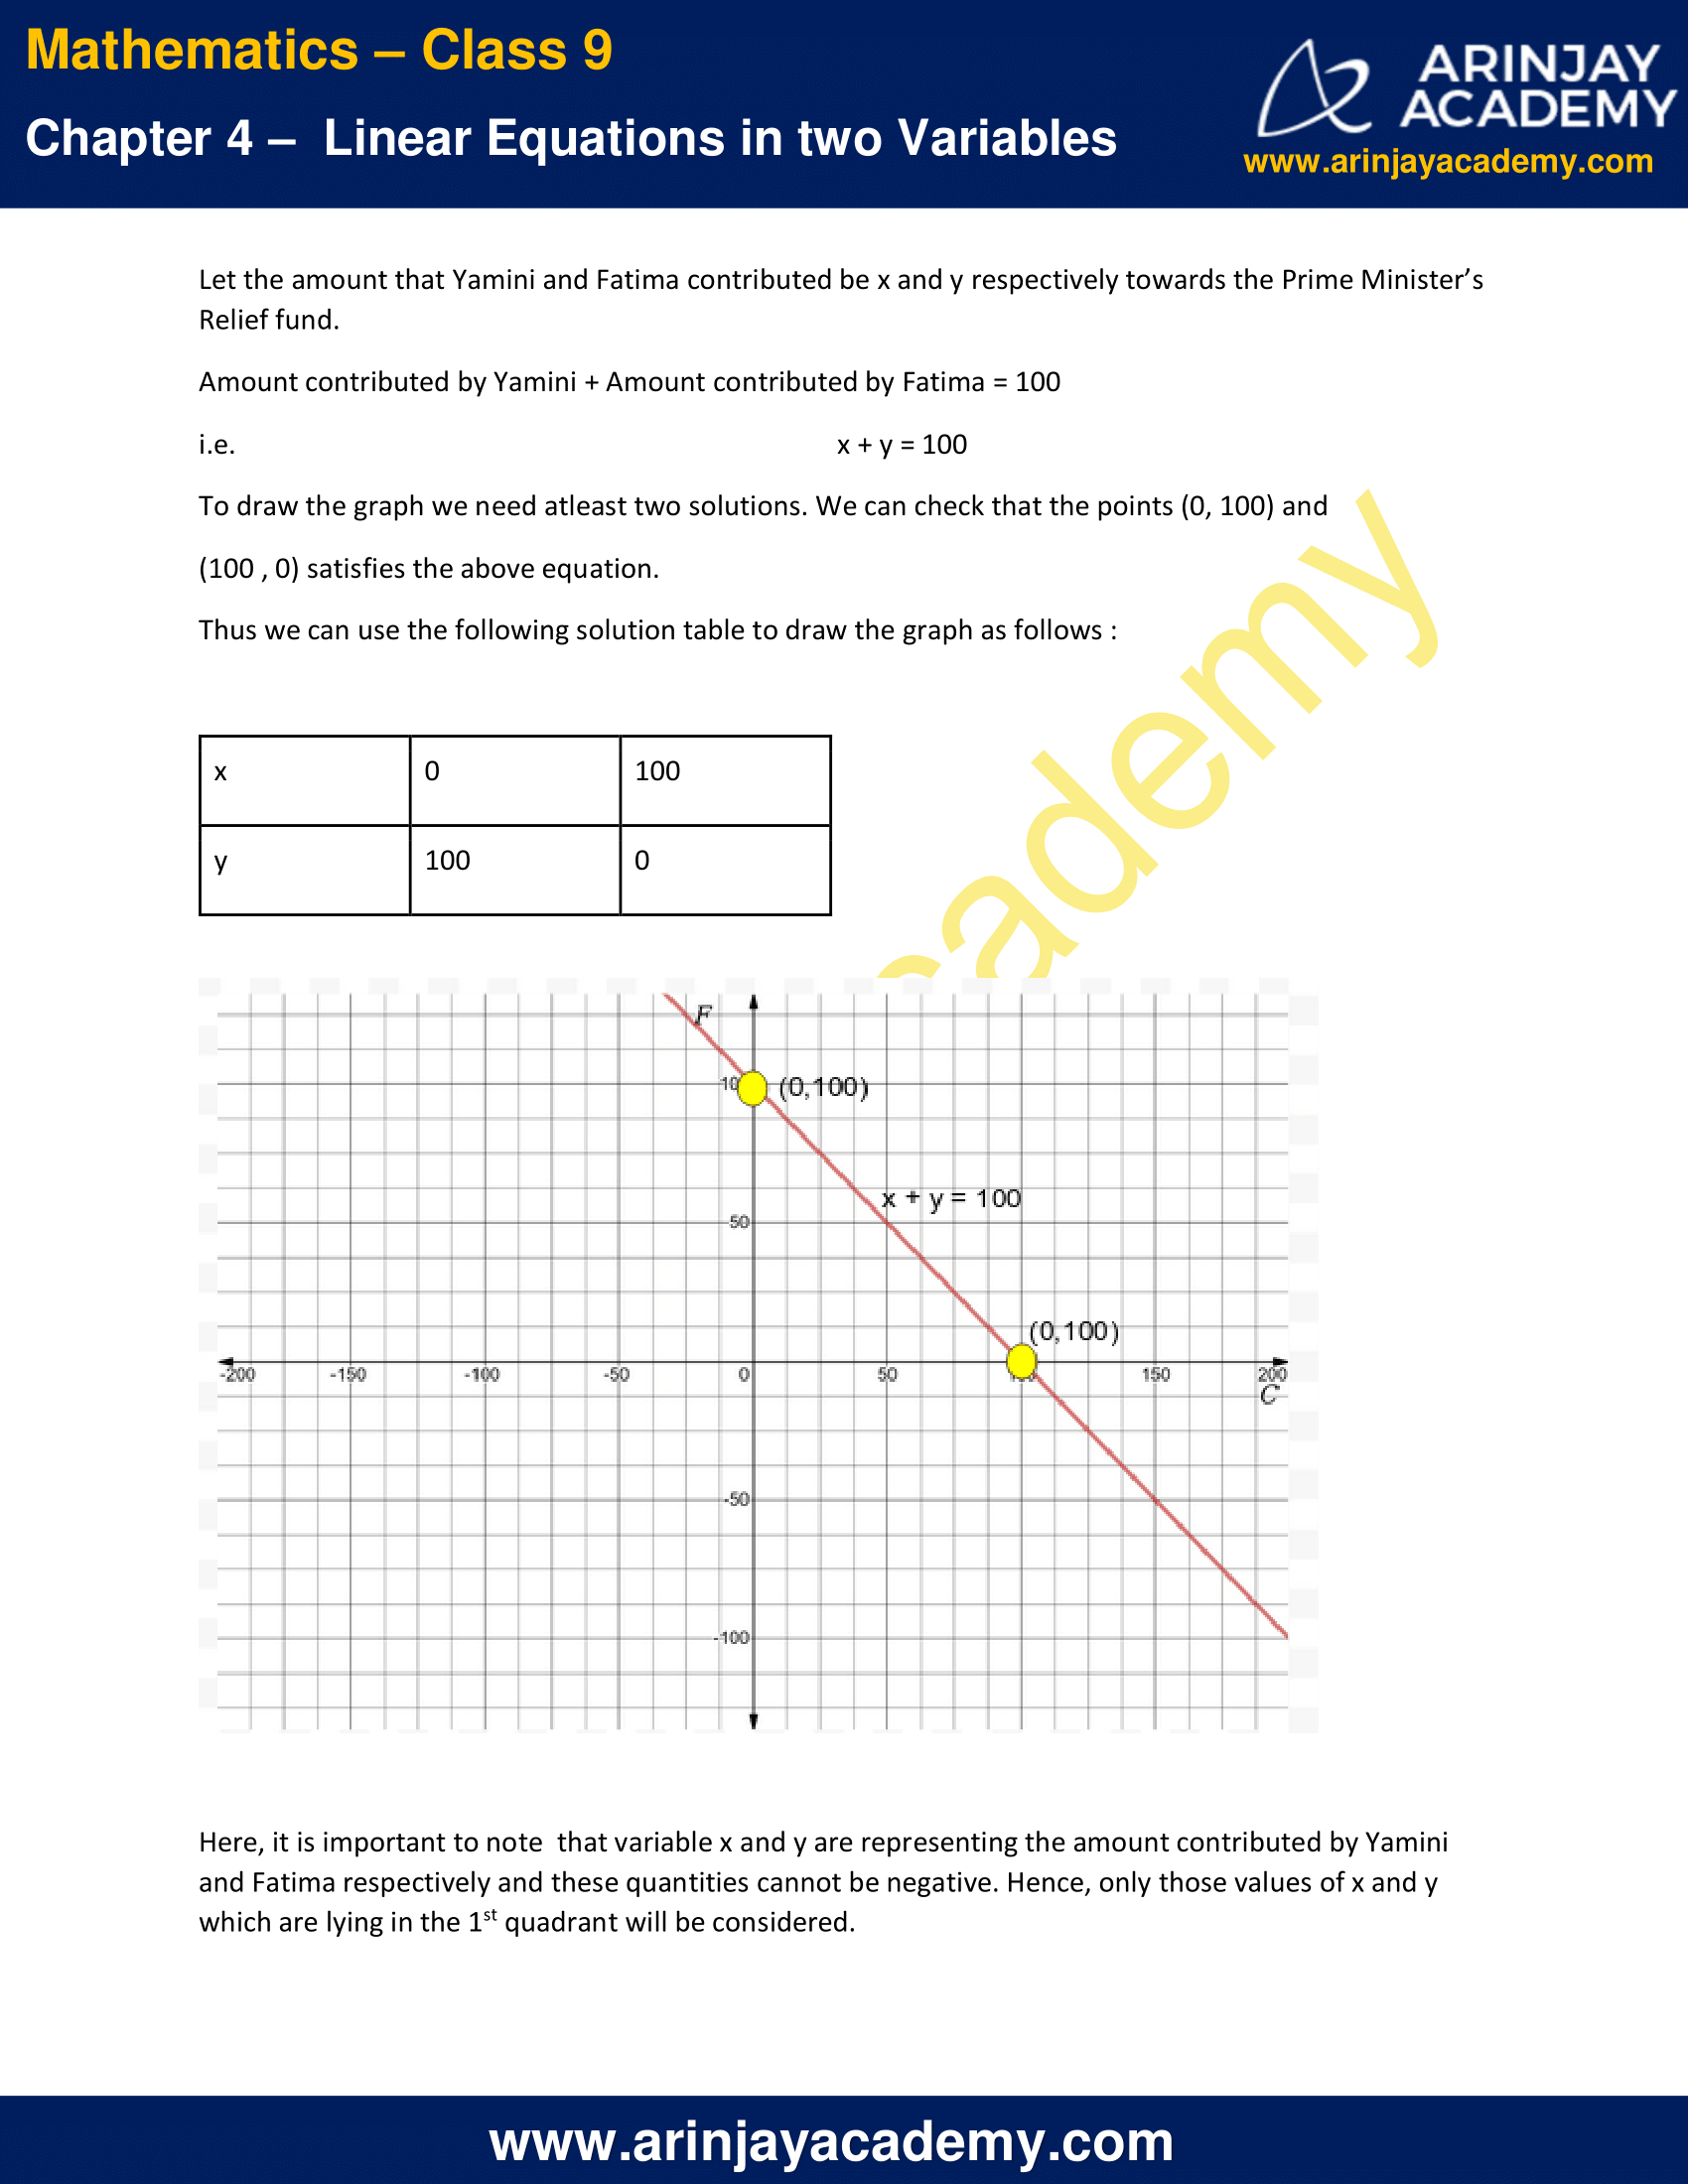
i.e. x + y = 100
To draw the graph we need atleast two solutions. We can check that the points (0, 100) and (100 , 0) satisfies the above equation.
Thus we can use the following solution table to draw the graph as follows :
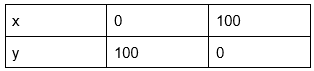
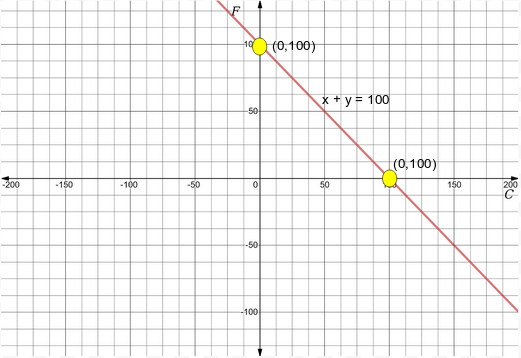
Here, it is important to note that variable x and y are representing the amount contributed by Yamini and Fatima respectively and these quantities cannot be negative. Hence, only those values of x and y which are lying in the 1st quadrant will be considered.
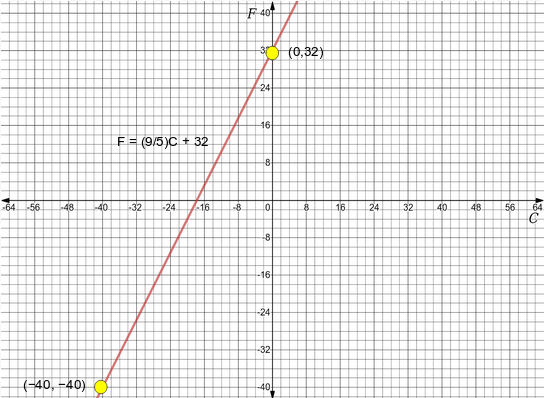
8. In countries like USA and Canada, temperature is measured in Fahrenheit, whereas in countries like India, it is measured in Celsius. Here is a linear equation that converts Fahrenheit to Celsius:
F = (9/5)C + 32
(i) Draw the graph of the linear equation above using Celsius for x-axis and Fahrenheit for y-axis.
(ii) If the temperature is 30°C, what is the temperature in Fahrenheit?
(iii) If the temperature is 95°F, what is the temperature in Celsius?
(iv) If the temperature is 0°C, what is the temperature in Fahrenheit and if the temperature is 0°F, what is the temperature in Celsius?
(v) Is there a temperature which is numerically the same in both Fahrenheit and Celsius? If yes, find it.
Solution :
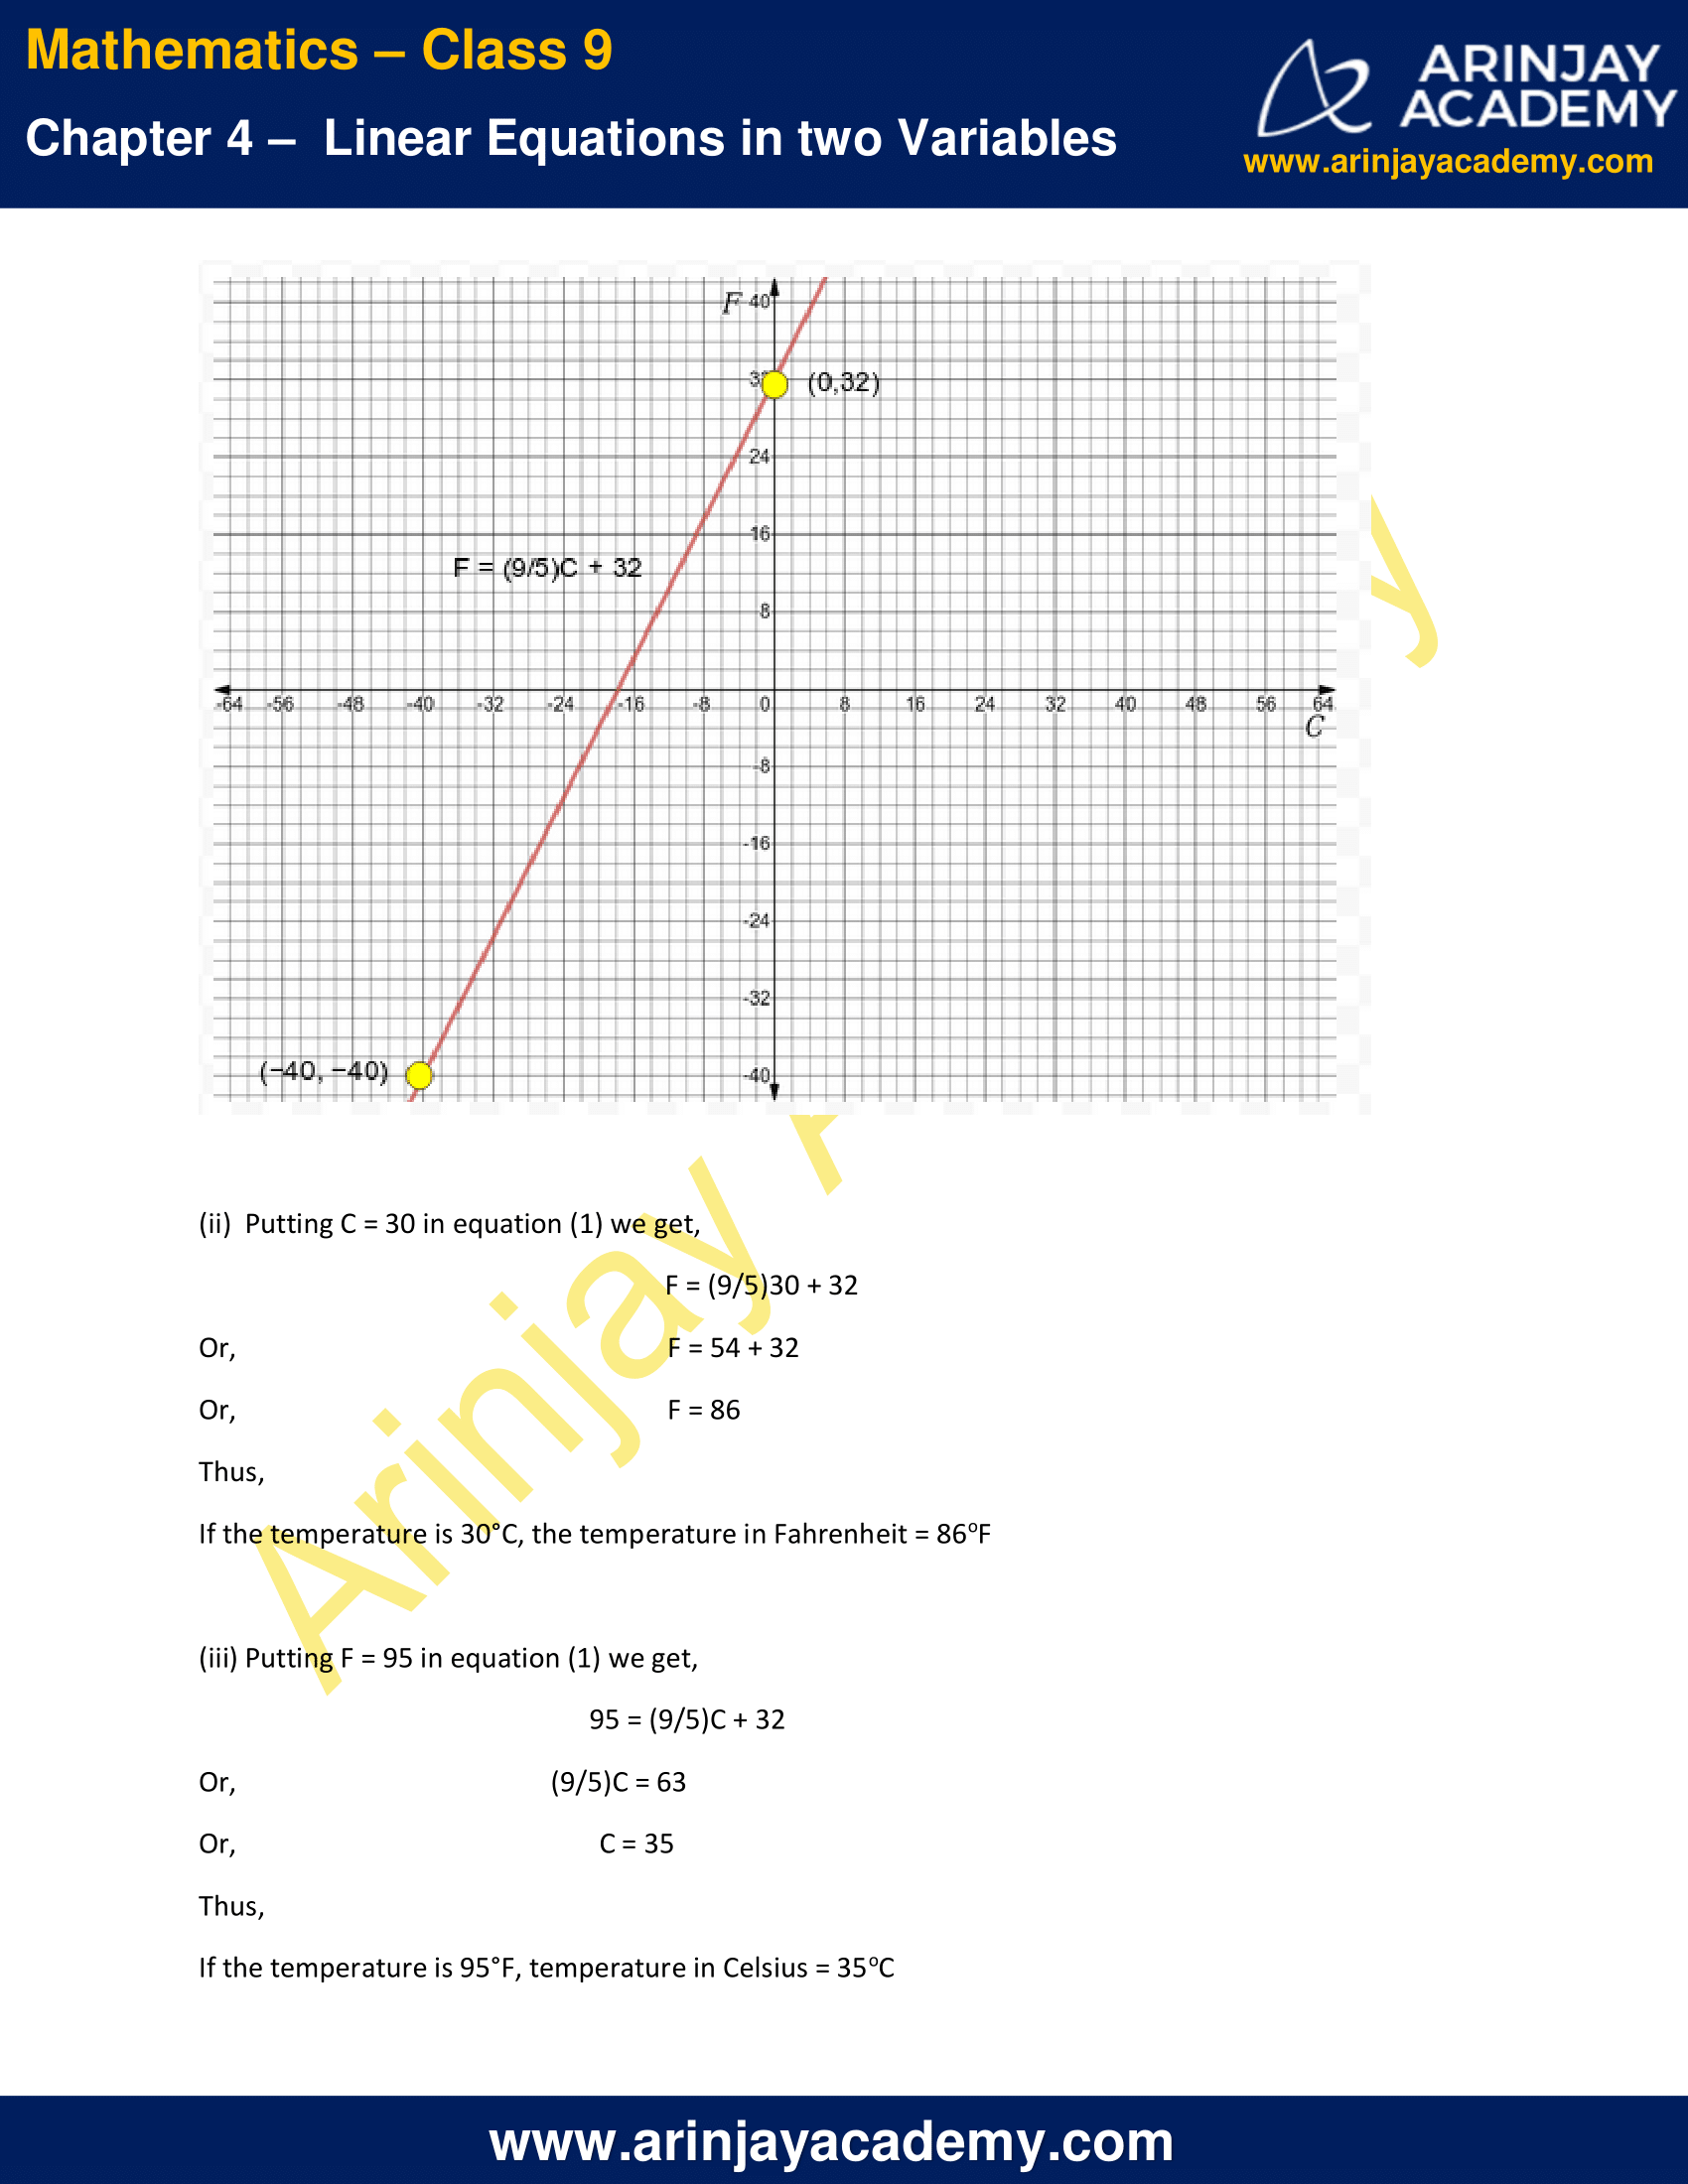
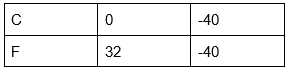
(i) Given equation
F = (9/5)C + 32 (1)
To draw the graph we need atleast two solutions. We can check that the points (0, 32) and (−40, −40) satisfies the above equation.
Thus we can use the following solution table to draw the graph as follows :
(ii) Putting C = 30 in equation (1) we get,
F = (9/5)30 + 32
F = 54 + 32
F = 86
Thus, If the temperature is 30°C, the temperature in Fahrenheit = 86oF
(iii) Putting F = 95 in equation (1) we get,
95 = (9/5)C + 32
(9/5)C = 63
C = 35
Thus, If the temperature is 95°F, temperature in Celsius = 35oC
(iv) Putting C = 0 in equation (1) we get,
F = (9/5)0 + 32
F = 0 + 32
F = 32
Thus, If the temperature is 0°C, the temperature in Fahrenheit = 32oF
Putting F = 0 in equation (1) we get,
0 = (9/5)C + 32
(9/5)C = -32
C = -160/9
C = -17.8
Thus, If the temperature is 0°F, temperature in Celsius = -17.5oC
(v) Putting C = F in equation (1) we get,
F = (9/5)F + 32
F(1 – 9/5) = 32
F(-⅘ ) = 32
F = -40
Thus, If the temperature is -40°C, the temperature in Fahrenheit = -40oF
NCERT Solutions for Class 9 Maths Chapter 4 Exercise 4.3 – Linear Equations in two Variables, has been designed by the NCERT to test the knowledge of the student on the topic – Graph of a Linear Equation in Two Variables
The next Exercise for NCERT Solutions for Class 9 Maths Chapter 4 Exercise 4.4 – Linear Equations in two Variables can be accessed by clicking here.
Download NCERT Solutions for Class 9 Maths Chapter 4 Exercise 4.3 – Linear Equations in two Variables