NCERT Solutions for Class 8 Maths Chapter 5 Exercise 5.1 – Data Handling, has been designed by the NCERT to test the knowledge of the student on the following topics :
- Looking for Information – Different types of graphs
A Pictograph
A bar graph
Double Bar Graph - Organising Data
- Grouping Data
Bars with a difference
NCERT Solutions for Class 8 Maths Chapter 5 Exercise 5.1 Data Handling
NCERT Solutions for Class 8 Maths Chapter 5 Exercise 5.1 Data Handling
Q.1 For which of these would you use a histogram to show the data?
(a) The number of letters for different areas in a postman’s bag.
(b) The height of competitors in an athletic meet.
(c) The number of cassettes produced by 5 companies.
(d) The number of passengers boarding trains from 7.00 a.m. to 7.00 p.m. at a station.
Give reasons for each.
Solution:
In case of (b) and (d) histogram is used to show the data
Histogram is a graphical representation of data if the data is measured in manner of class intervals.
In case of (b), heights of different players in an athletic meet in intervals (range) of height
In case of (d), the number of passengers boarding the trains at an interval of one hour at a station
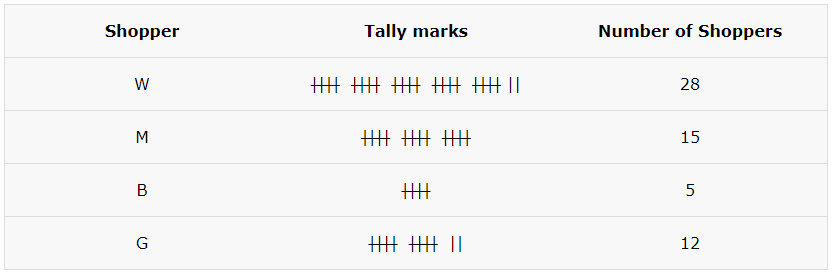
Q.2 The shoppers who come to a departmental store are marked as: man (M), woman (W), boy (B) or girl (G). The following list gives the shoppers who came during the first hour in the morning:
W W W G B W W M G G M M W W W W G B M W B G G M W W M M W W W M W B W G M W W W W G W M M W W M W G W M G W M M B G G W
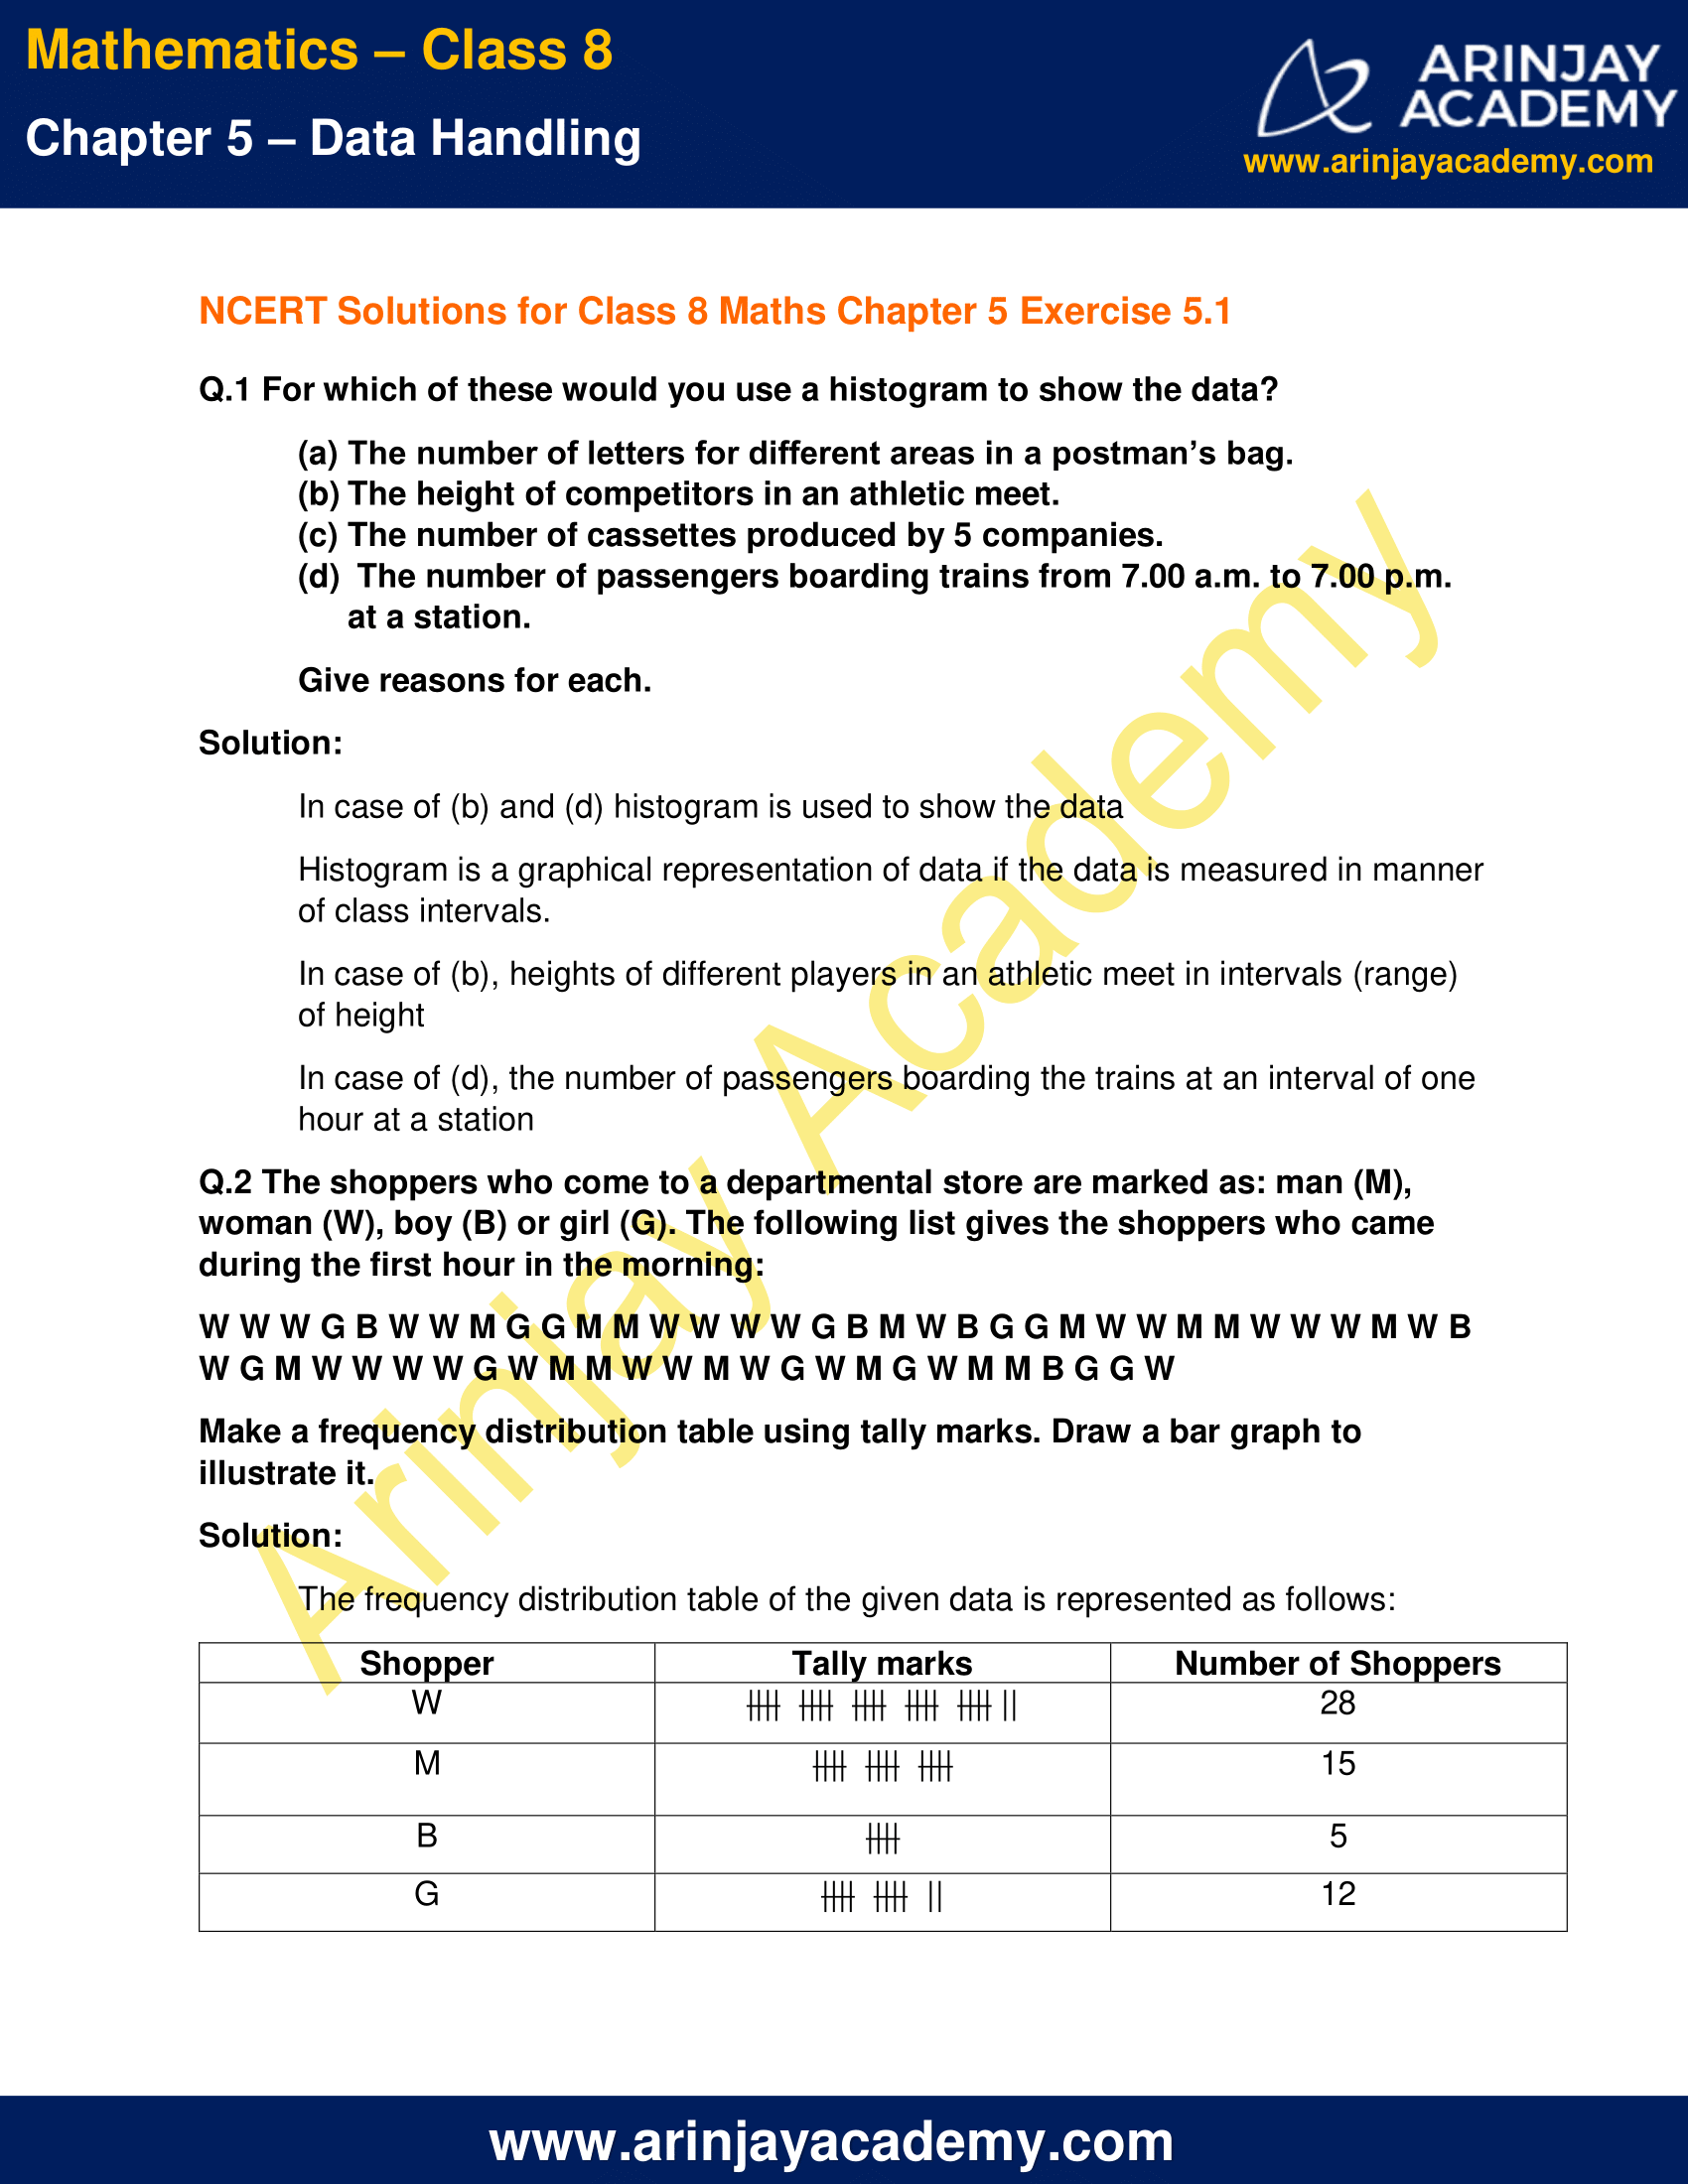
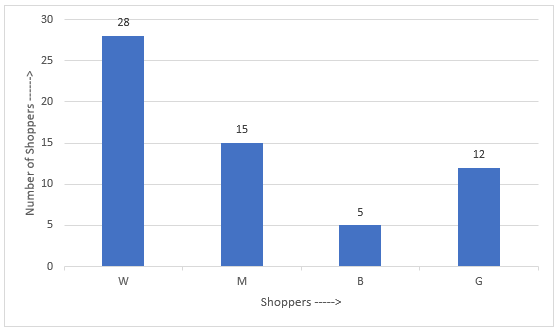
Make a frequency distribution table using tally marks. Draw a bar graph to illustrate it.
Solution:
The frequency distribution table of the given data is represented as follows:
The illustration of data by bar graph:
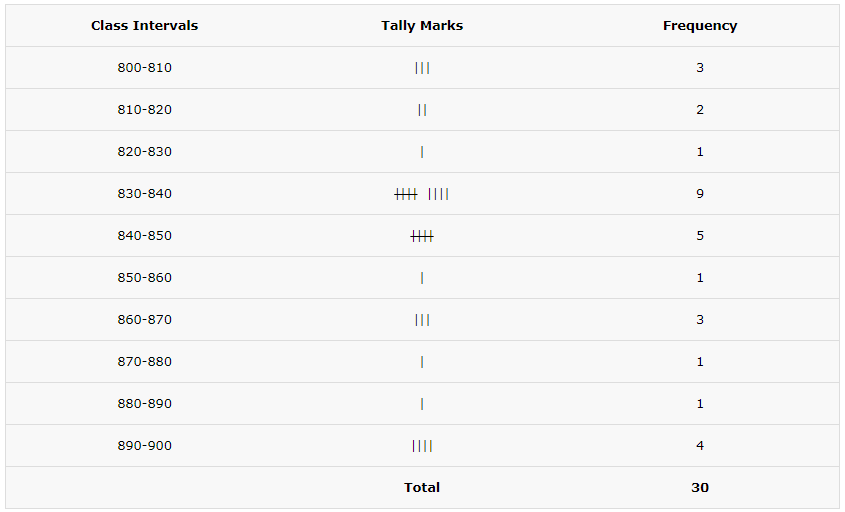
Q.3 The weekly wages (in ₹) of 30 workers in a factory are.
830, 835, 890, 810, 835, 836, 869, 845, 898, 890, 820, 860, 832, 833, 855, 845, 804, 808, 812, 840, 885, 835, 835, 836, 878, 840, 868, 890, 806, 840
Using tally marks make a frequency table with intervals as 800–810, 810–820 and so on.
Solution:
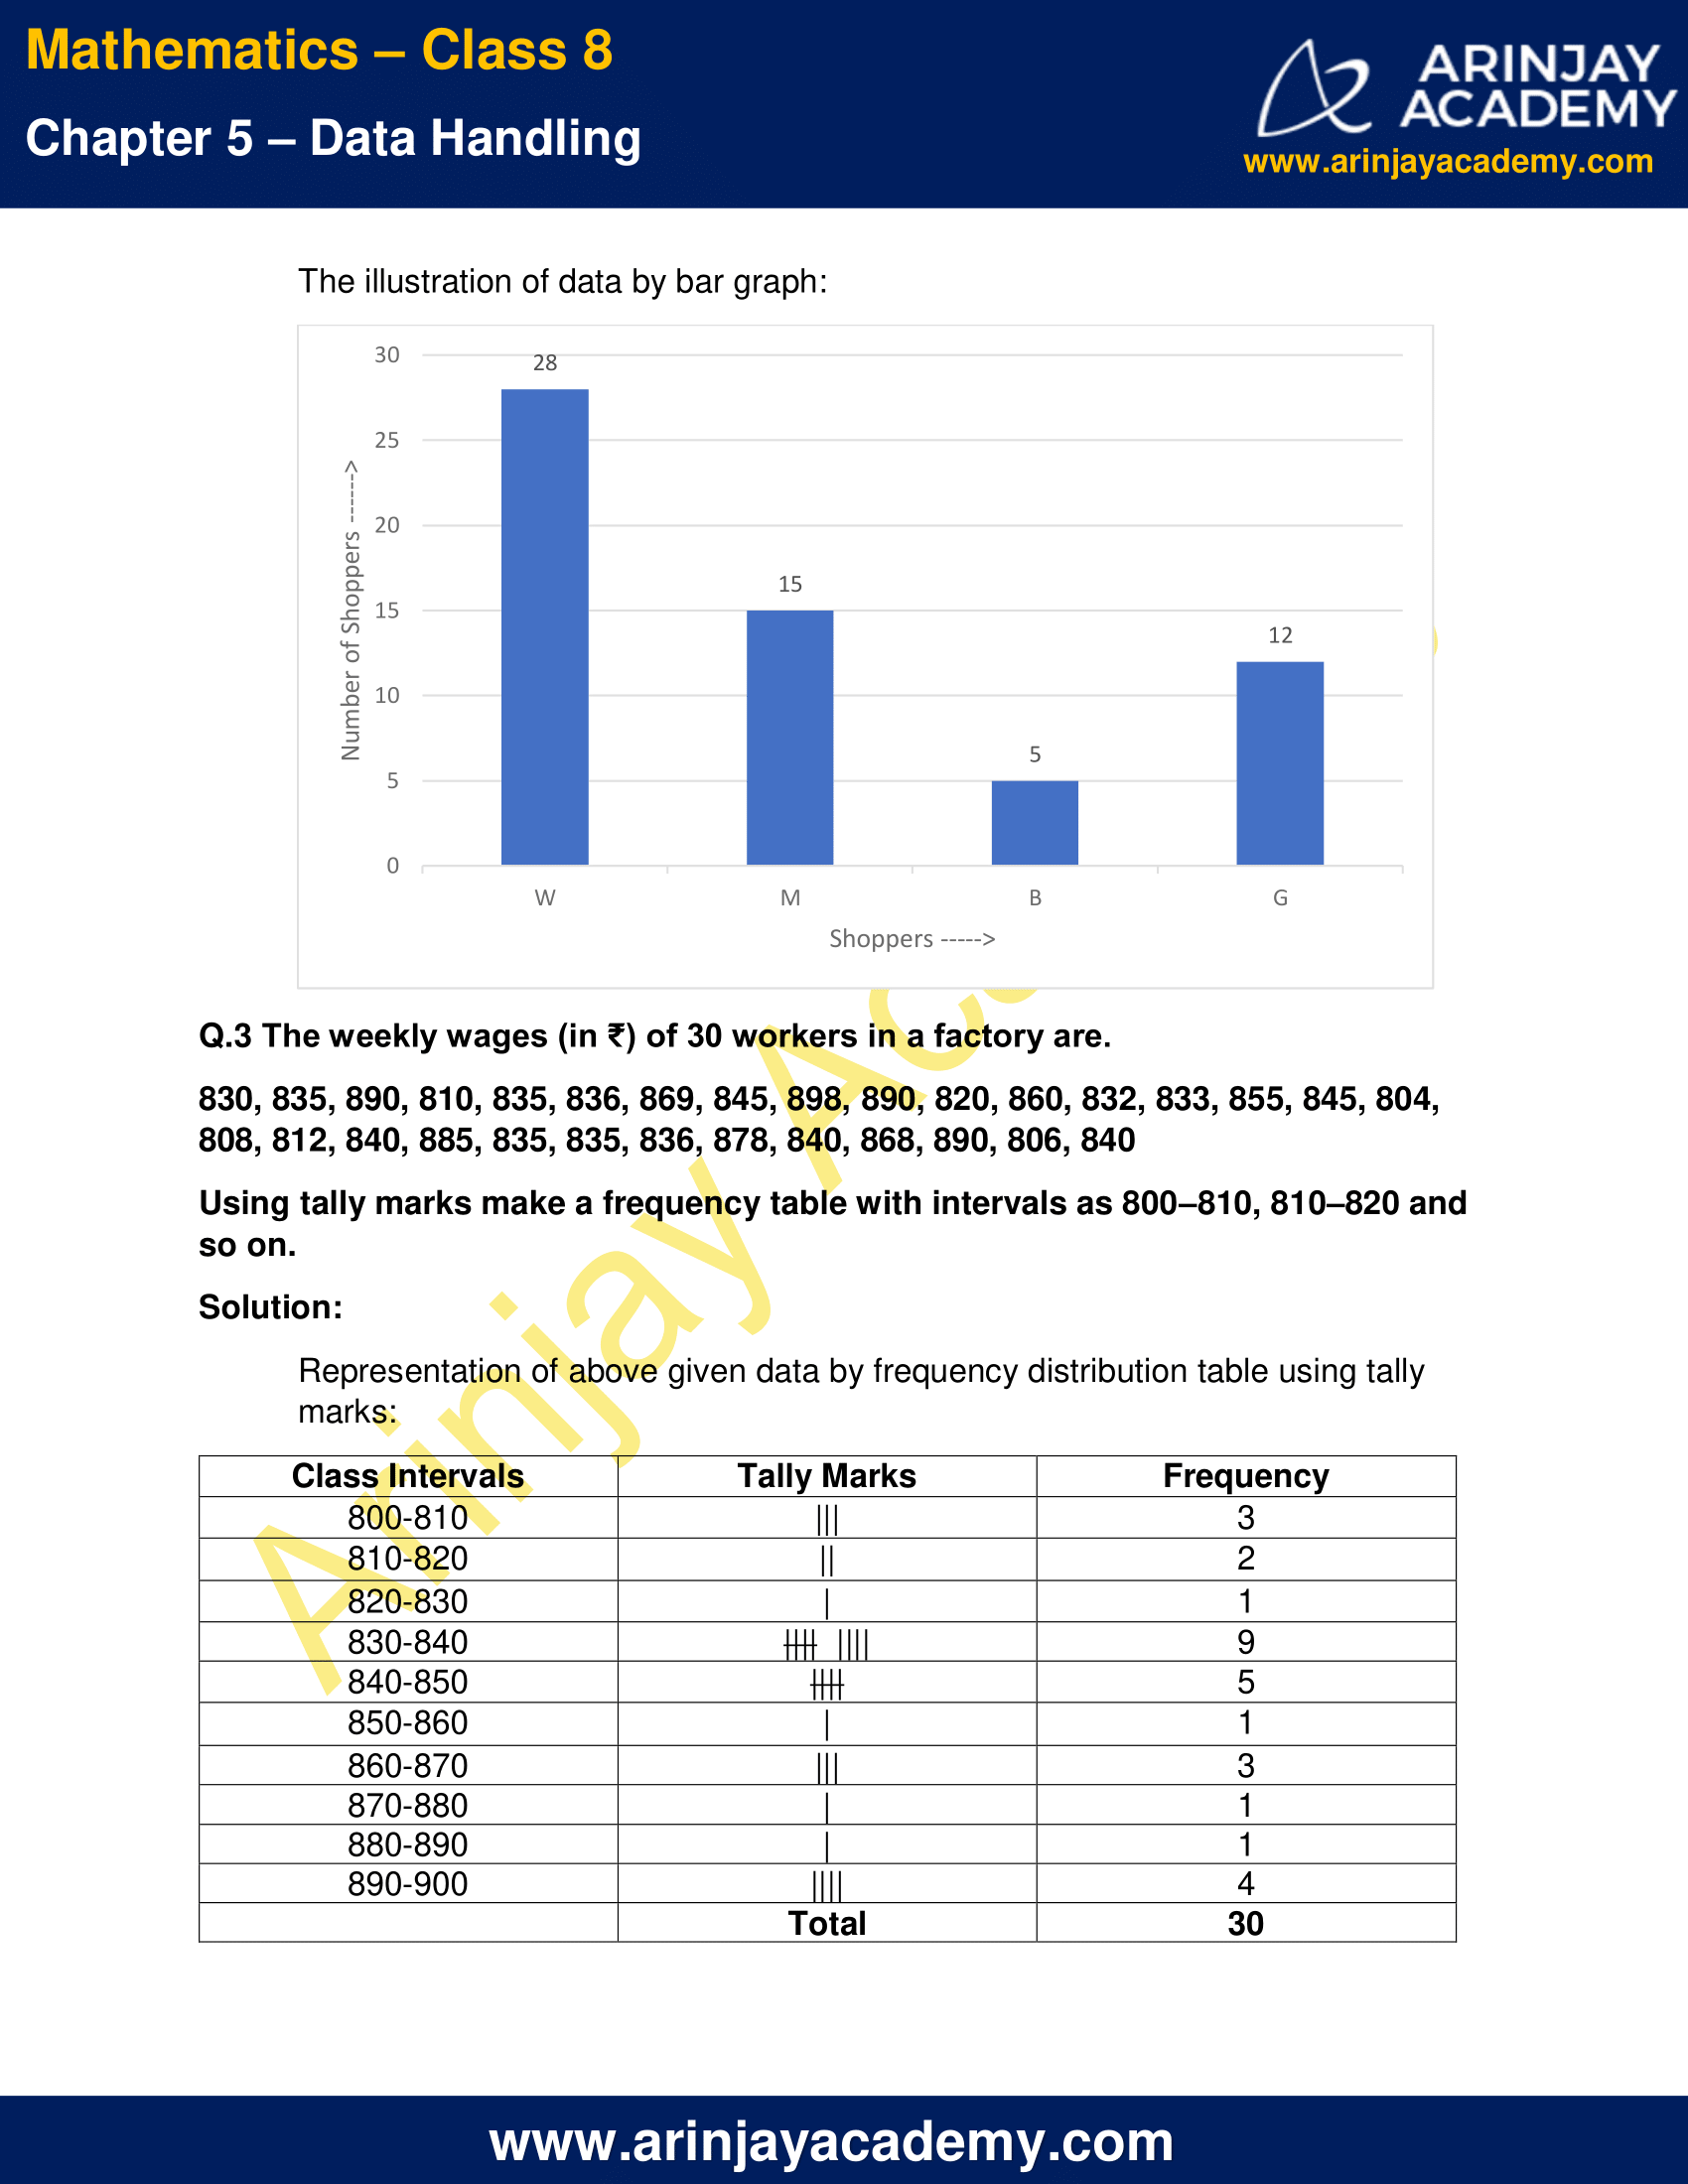
Representation of above given data by frequency distribution table using tally marks:
Q.4 Draw a histogram for the frequency table made with for the data in Ques 3, and answer the following questions.
(i) Which group has the maximum number of workers?
(ii) How many workers earn ₹ 850 and more?
(iii) How many workers earn less than ₹ 850?
Solution:
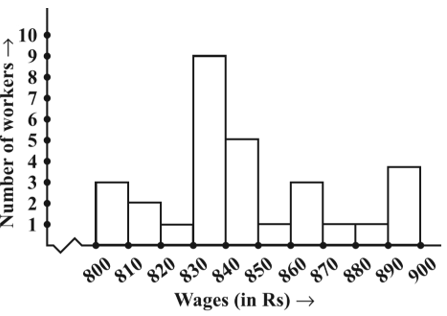
(i) 830 – 840 group has the maximum number of workers
(ii) 10 workers earn ₹ 850 and more
(iii) 20 workers earn less than ₹ 850
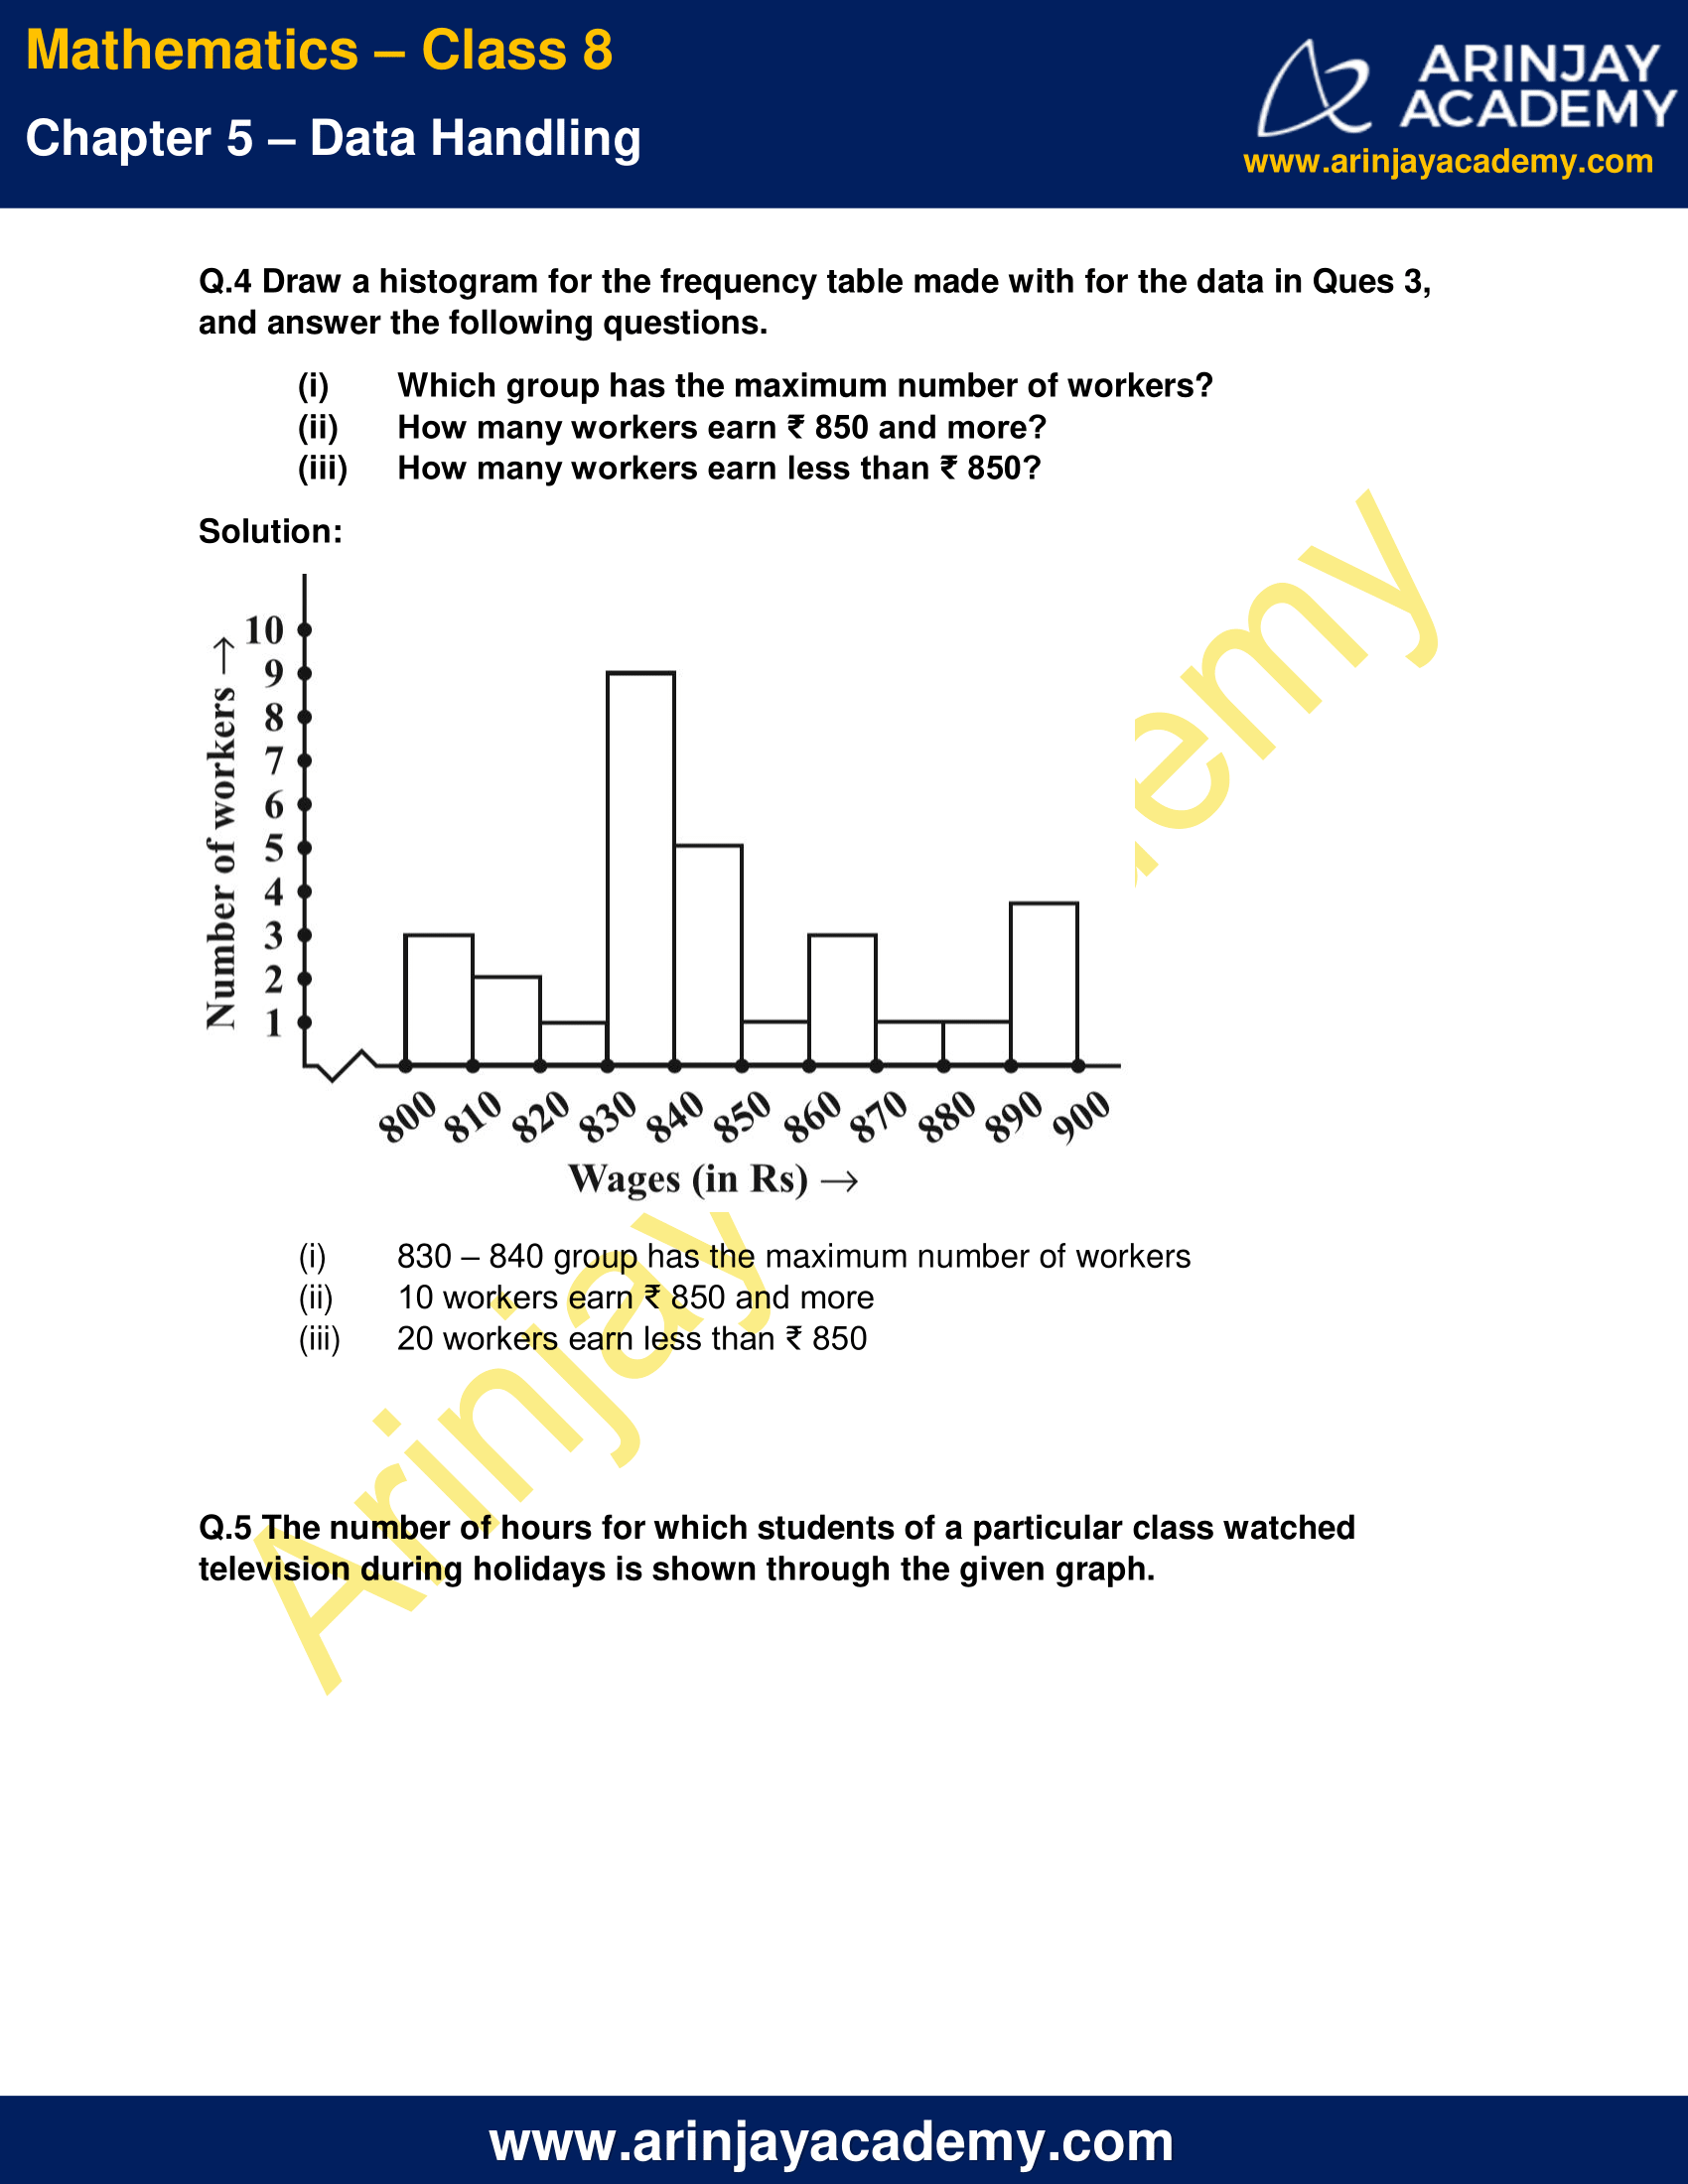
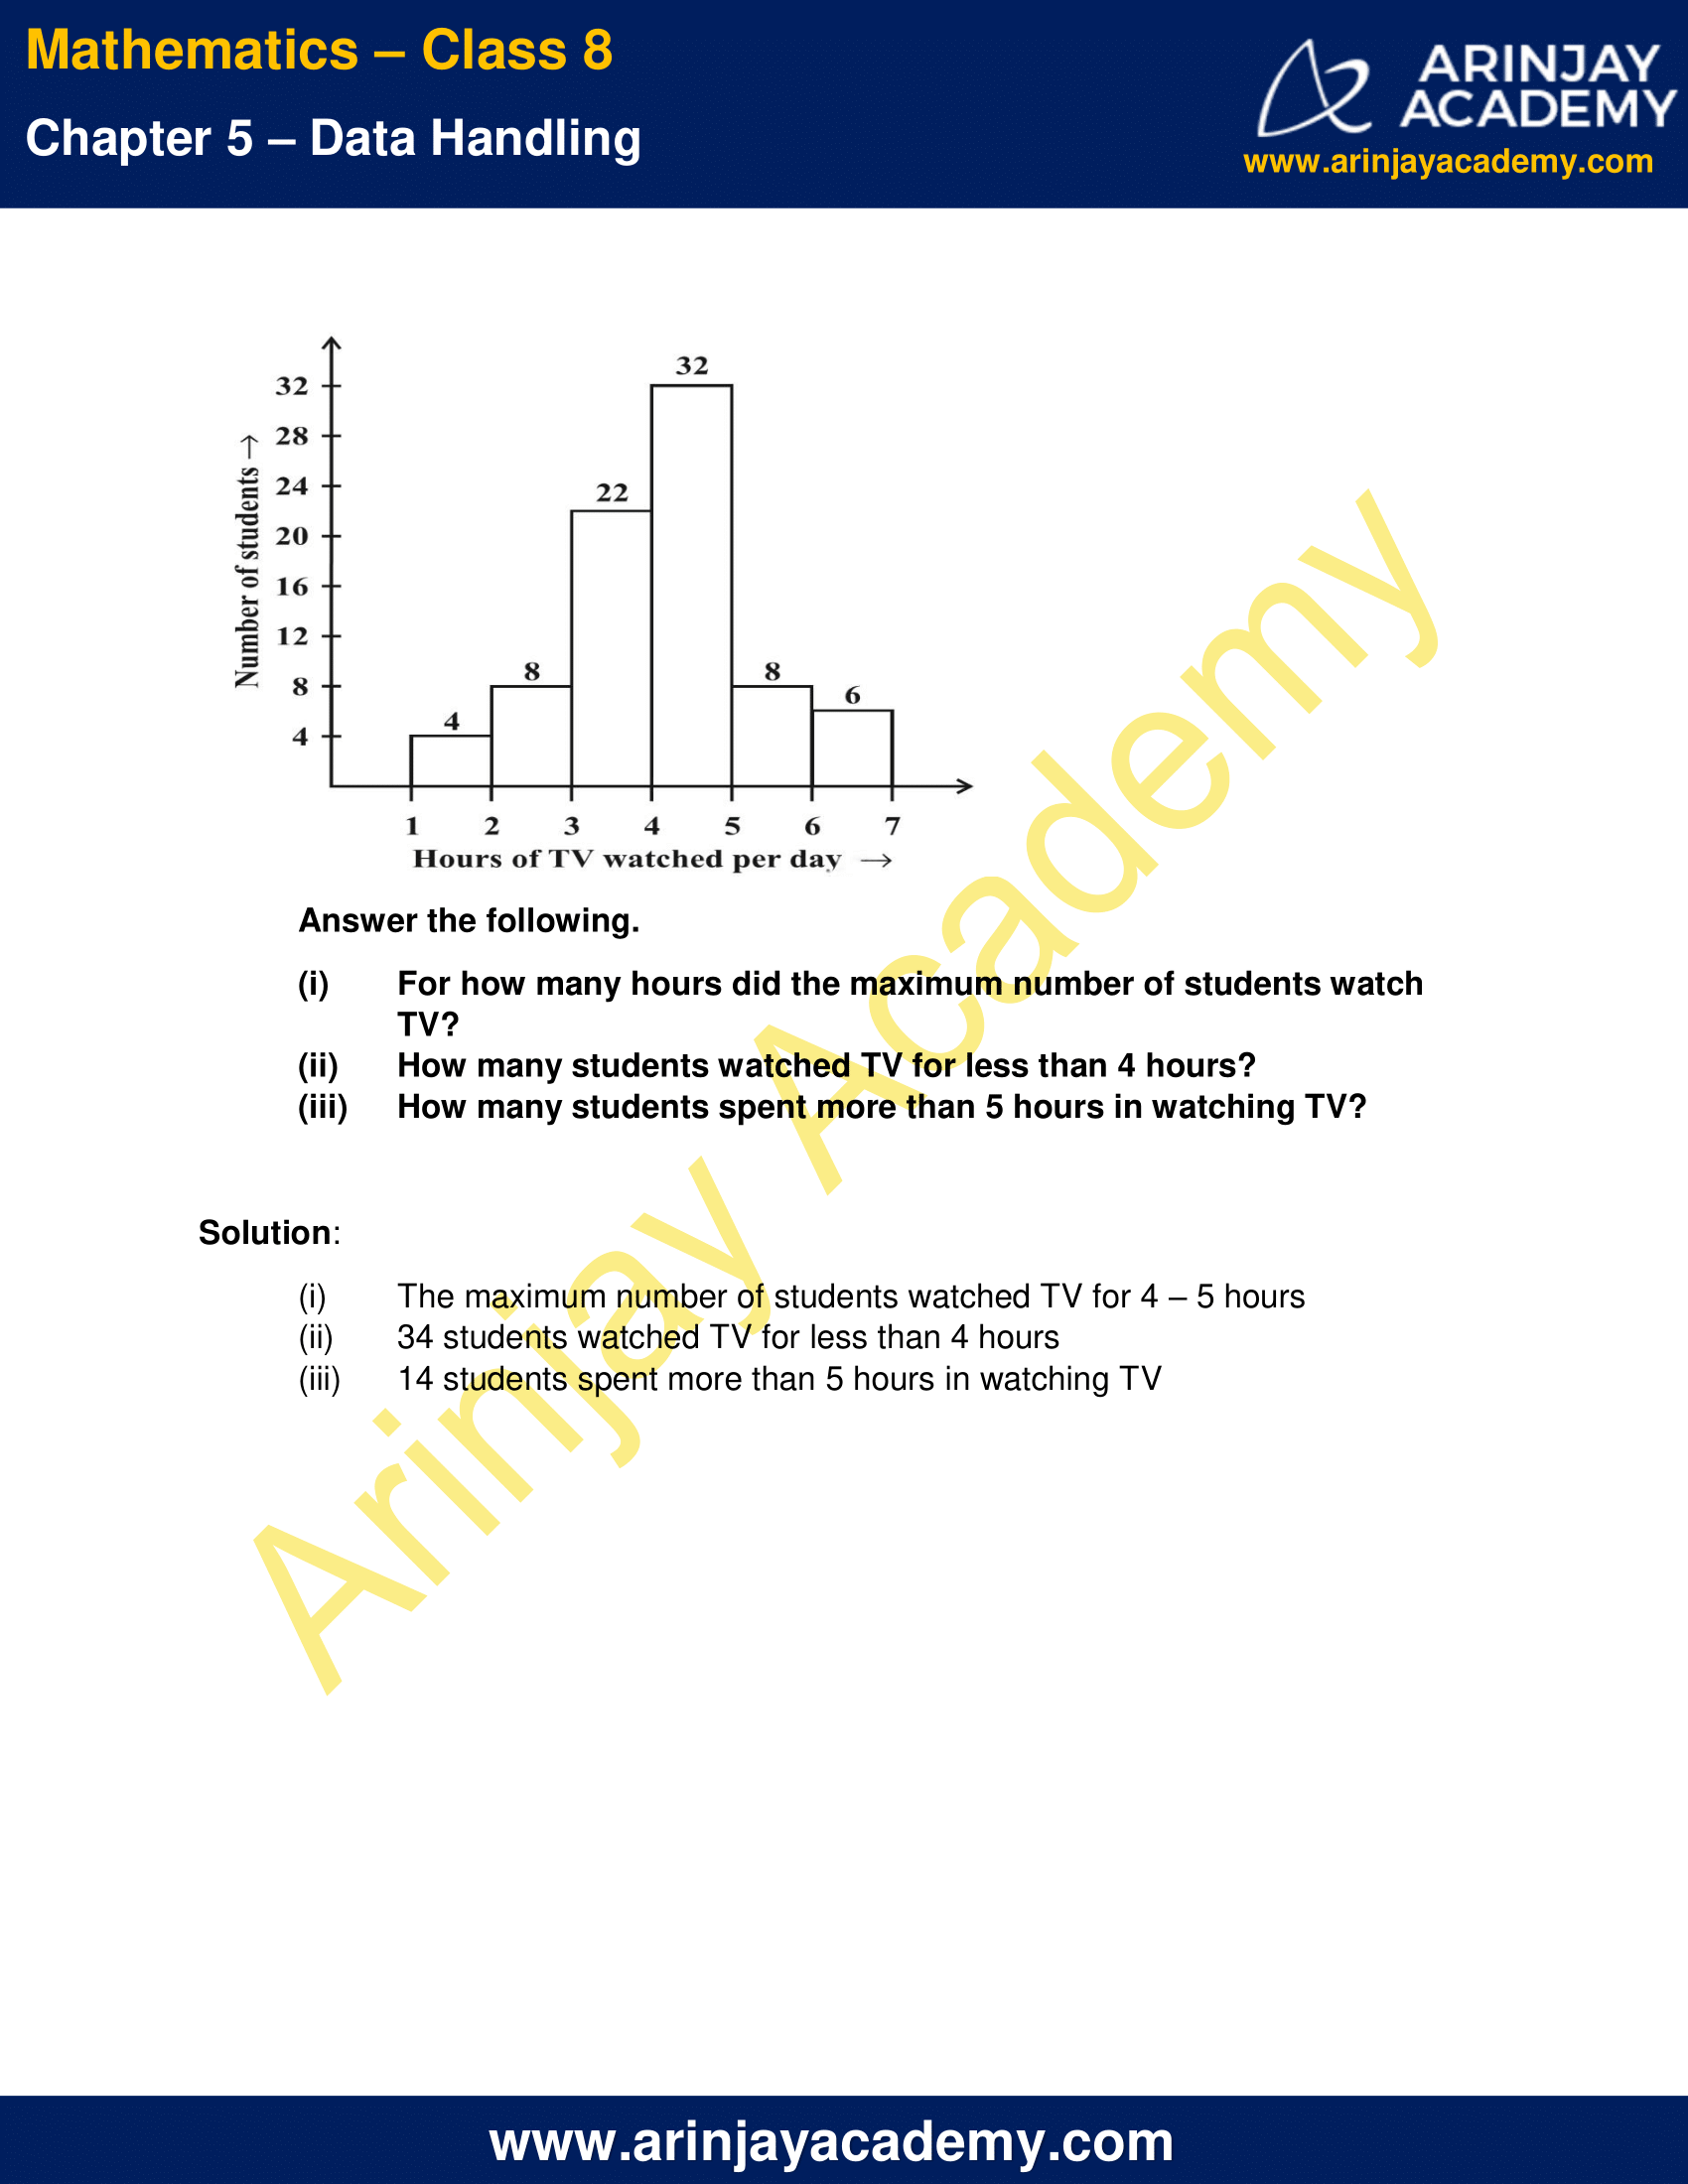
Q.5 The number of hours for which students of a particular class watched television during holidays is shown through the given graph.
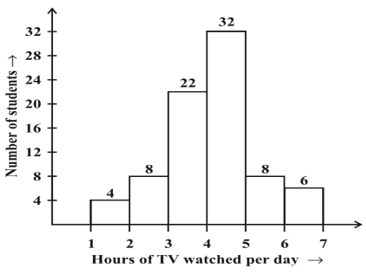
Answer the following.
(i) For how many hours did the maximum number of students watch TV?
(ii) How many students watched TV for less than 4 hours?
(iii) How many students spent more than 5 hours in watching TV?
Solution:
(i) The maximum number of students watched TV for 4 – 5 hours
(ii) 34 students watched TV for less than 4 hours
(iii) 14 students spent more than 5 hours in watching TV
The next Exercise for NCERT Solutions for Class 8 Maths Chapter 5 Exercise 5.2 – Data Handling can be accessed by clicking here.
Download NCERT Solutions for Class 8 Maths Chapter 5 Exercise 5.1 – Data Handling