Class 7 Maths NCERT Solutions Chapter 3 – Data Handling comprises of the 4 Exercises,
This Chapter contains the Exercises relating to the following topics , which are discussed in Chapter 3 – Data Handling Class 7 NCERT book : –
- 3.1 INTRODUCTION
- 3.2 COLLECTING DATA
- 3.3 ORGANISATION OF DATA
- 3.4 REPRESENTATIVE VALUES
- 3.5 ARITHMETIC MEAN
- 3.5.1 Range
- 3.6 MODE
- 3.6.1 Mode of Large Data
- 3.7 MEDIAN
- 3.8 USE OF BAR GRAPHS WITH A DIFFERENT PURPOSE
- 3.8.1 Choosing a Scale
- 3.9 CHANCE AND PROBABILITY
- 3.9.1 Chance
NCERT Solutions for Class 7 Maths Chapter 3 Exercise 3.1 – Data Handling
NCERT Solutions for Class 7 Maths Chapter 3 Exercise 3.2 – Data Handling
NCERT Solutions for Class 7 Maths Chapter 3 Exercise 3.3 – Data Handling
NCERT Solutions for Class 7 Maths Chapter 3 Exercise 3.4 – Data Handling
NCERT Solutions for Class 7 Maths Chapter 3 Exercise 3.1 – Data Handling
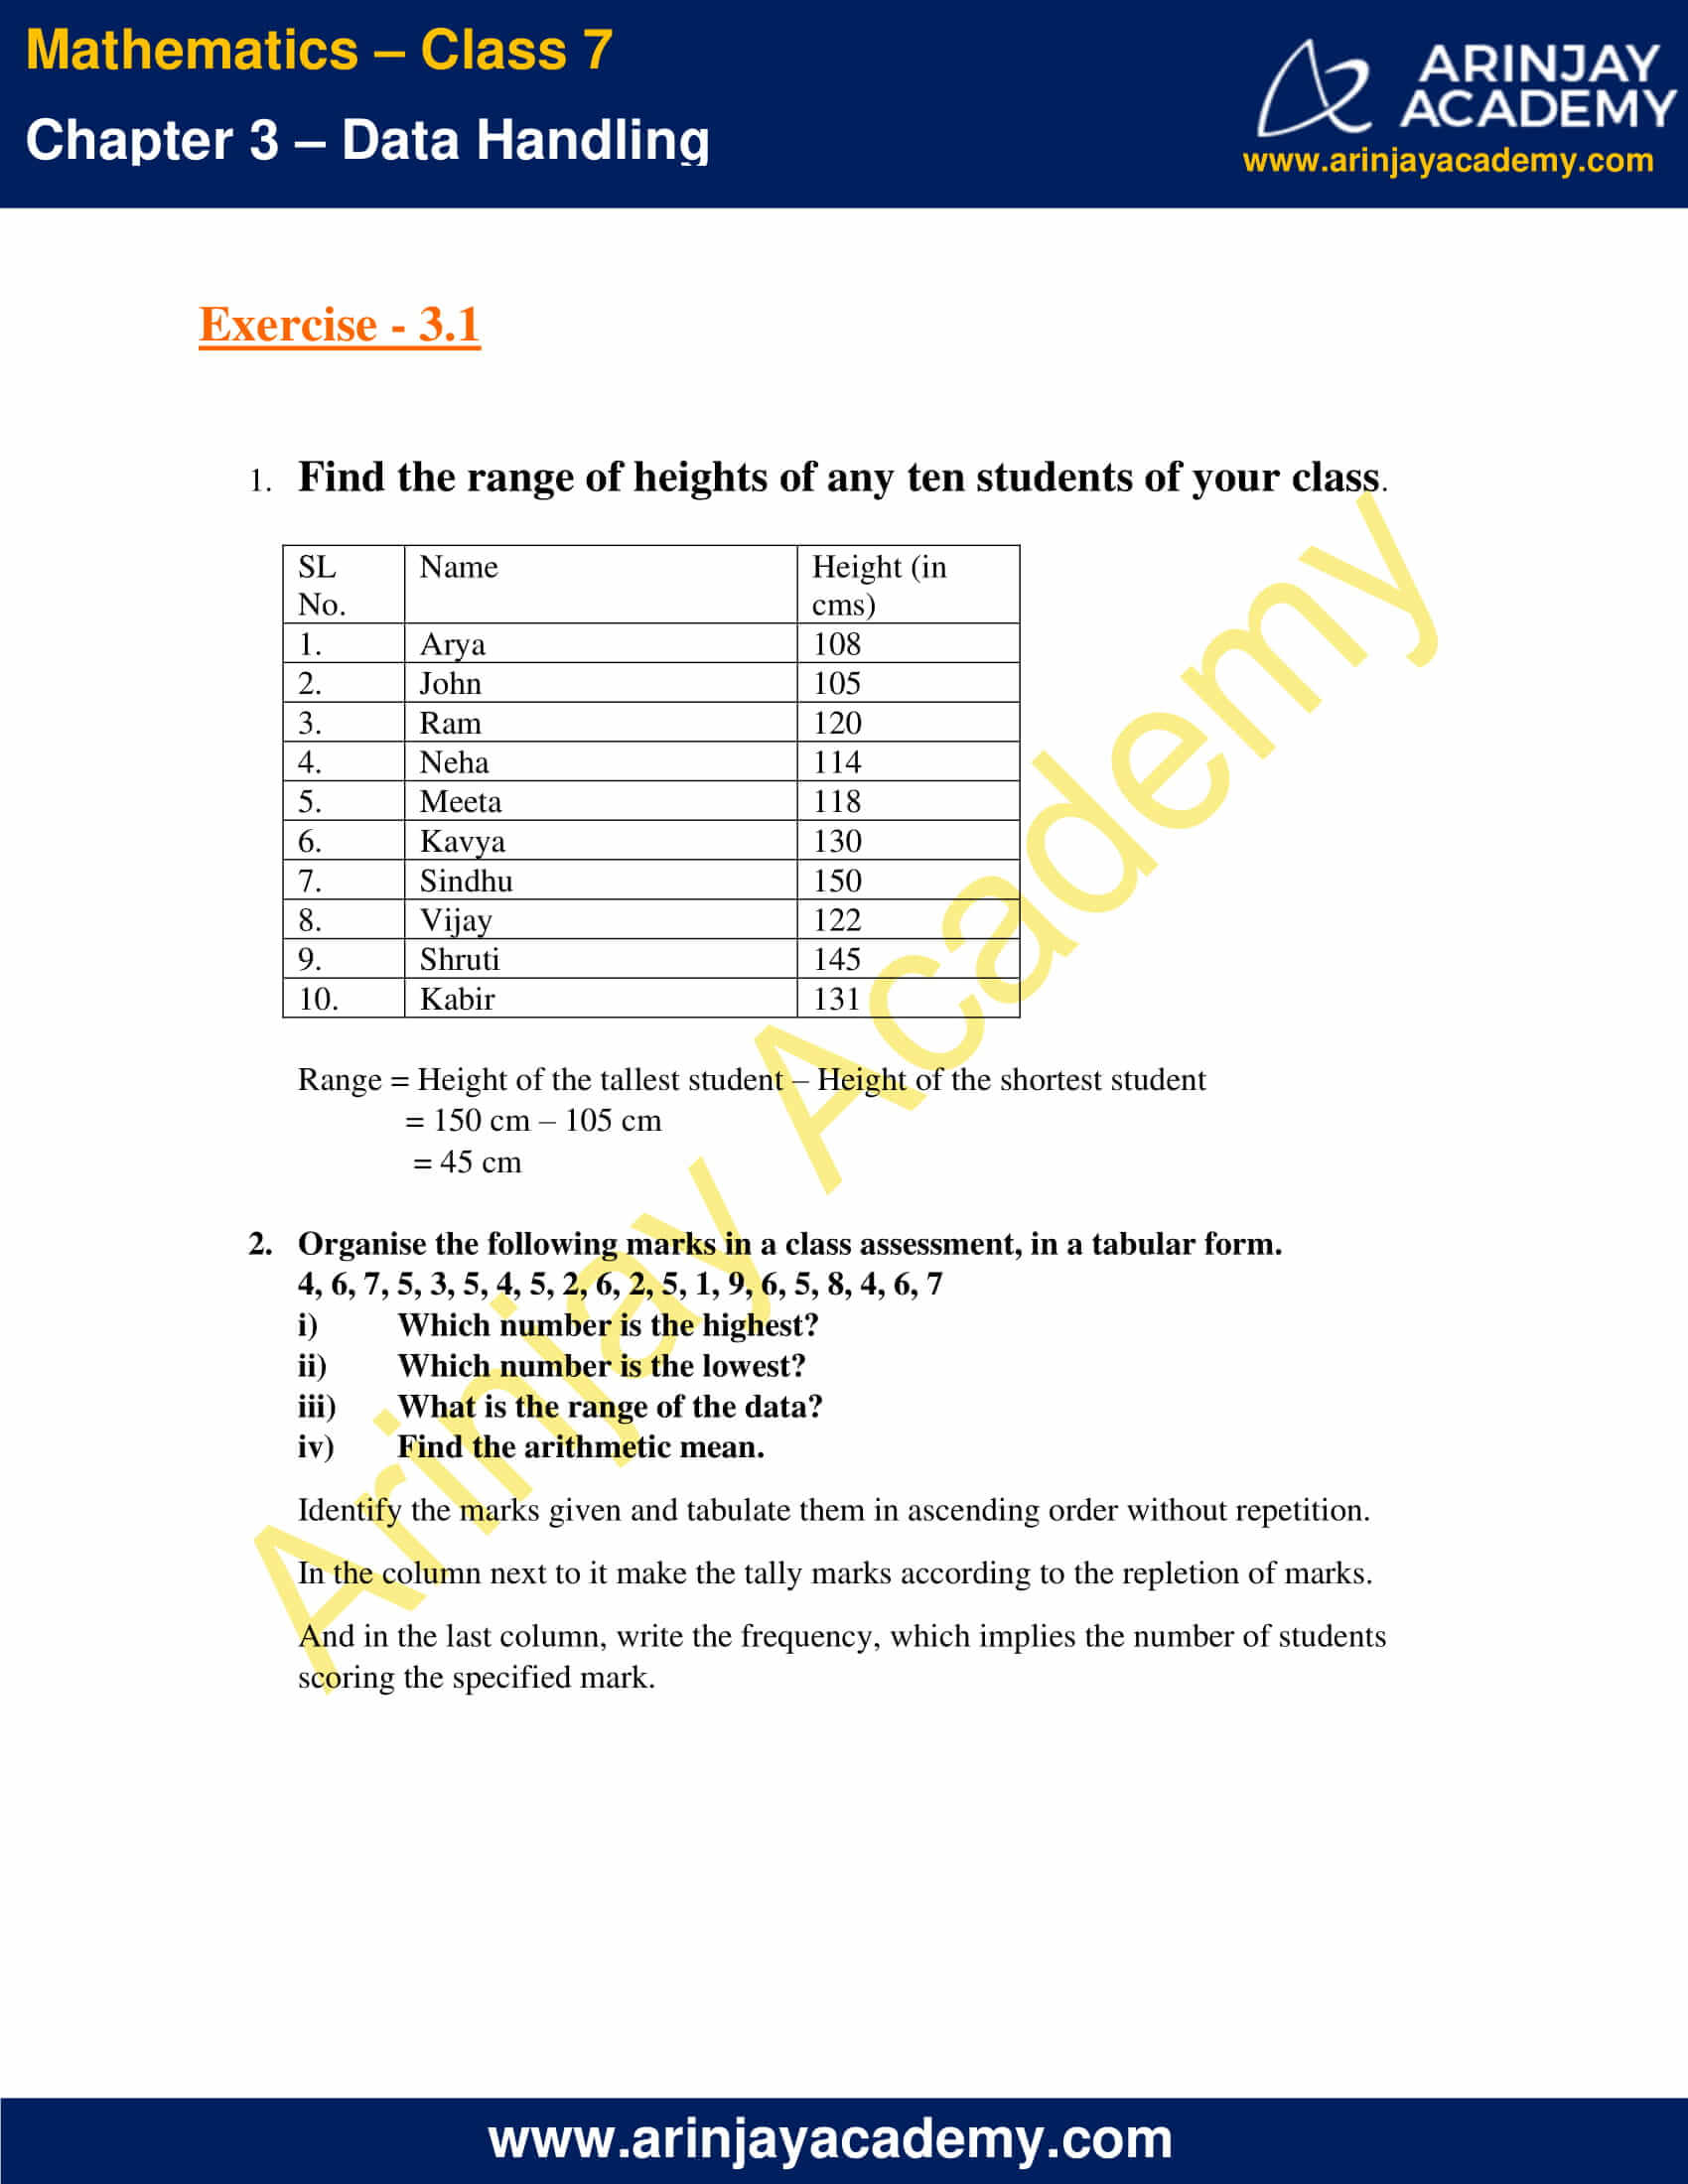
1. Find the range of heights of any ten students of your class.
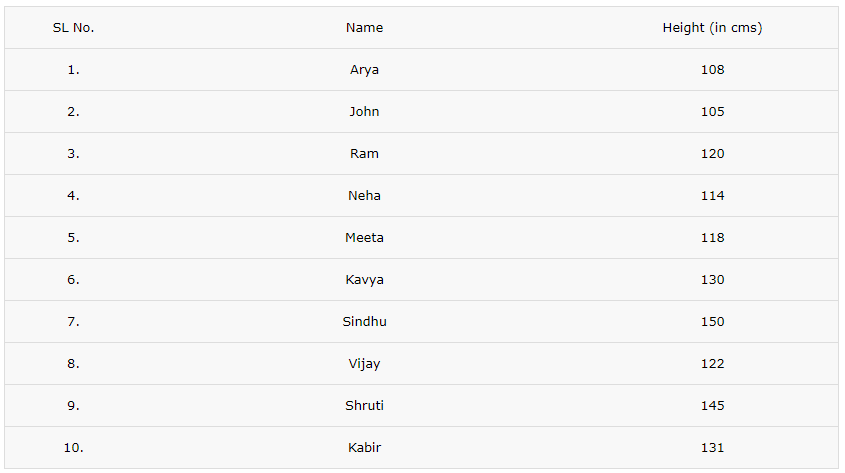
Range = Height of the tallest student – Height of the shortest student
= 150 cm – 105 cm
= 45 cm
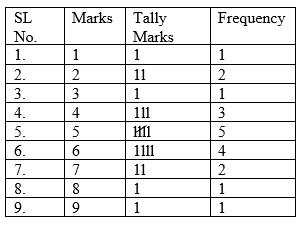
2. Organise the following marks in a class assessment, in a tabular form.
4, 6, 7, 5, 3, 5, 4, 5, 2, 6, 2, 5, 1, 9, 6, 5, 8, 4, 6, 7
i) Which number is the highest?
ii) Which number is the lowest?
iii) What is the range of the data?
iv) Find the arithmetic mean.
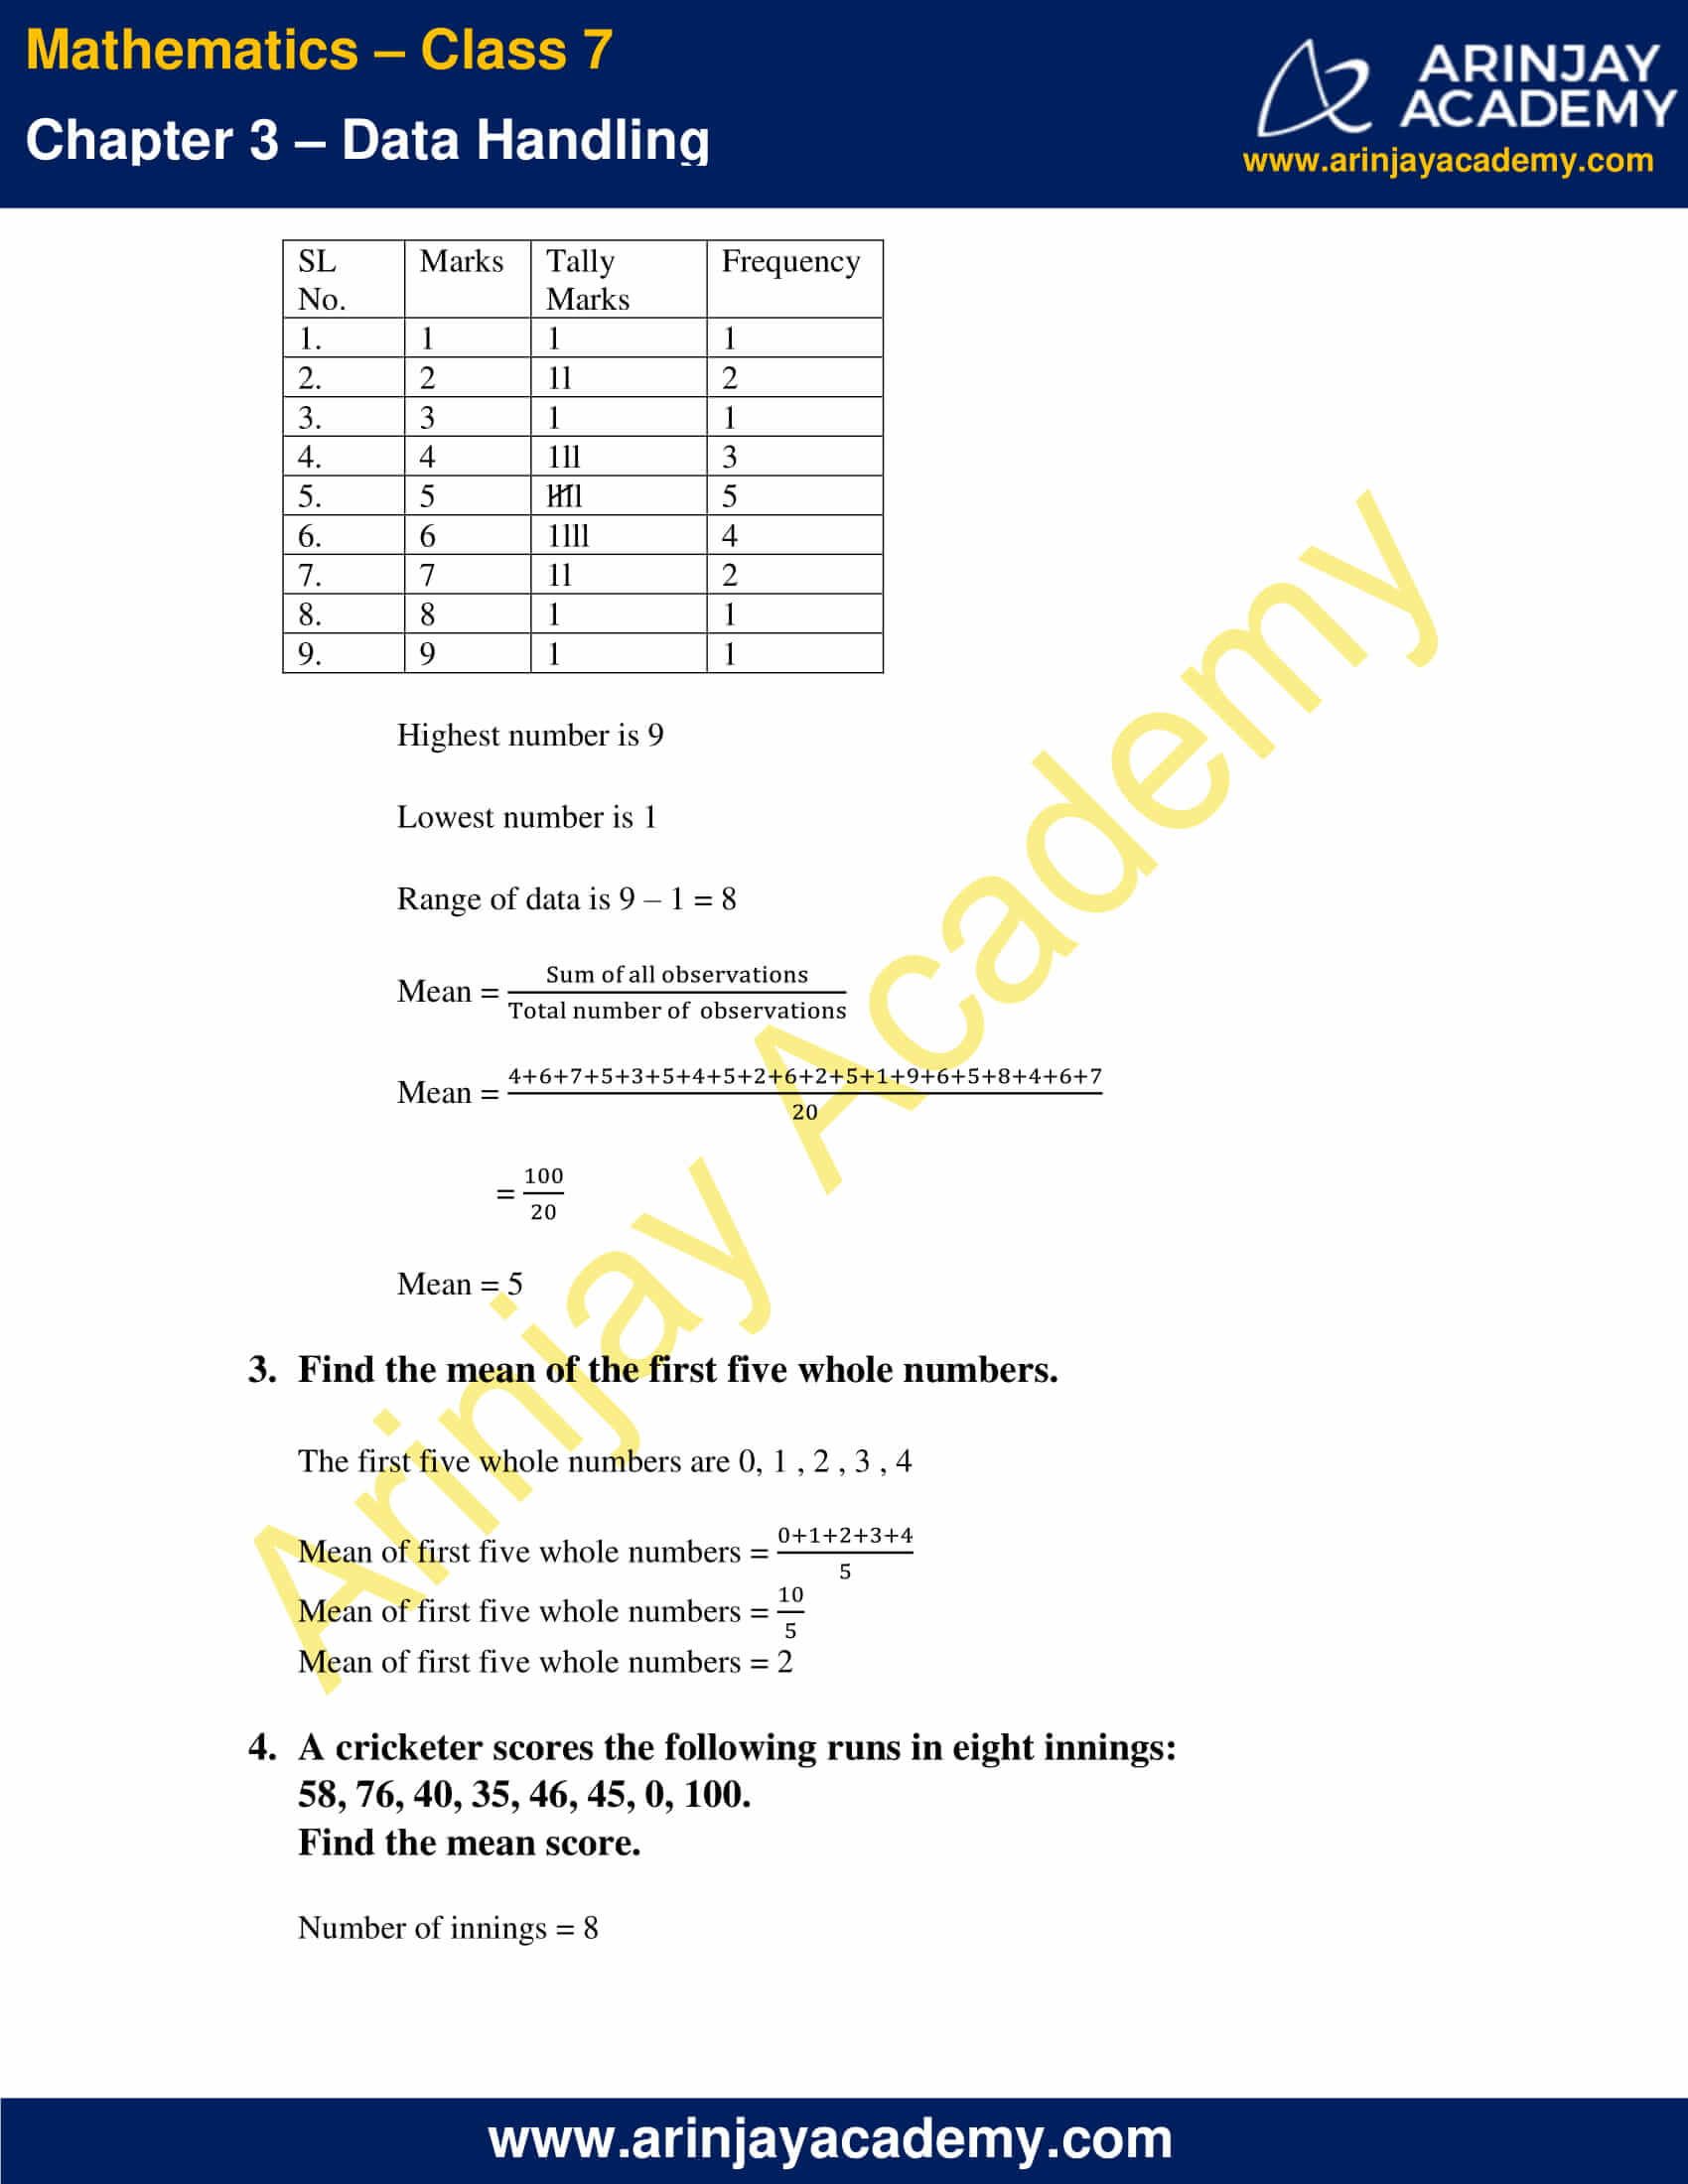
Identify the marks given and tabulate them in ascending order without repetition.
In the column next to it make the tally marks according to the repletion of marks.
And in the last column, write the frequency, which implies the number of students scoring the specified mark.
Highest number is 9
Lowest number is 1
Range of data is 9 – 1 = 8
Mean = (Sum of all observations)/(Total number of observations)
Mean = (4+6+7+5+3+5+4+5+2+6+2+5+1+9+6+5+8+4+6+7)/20
Mean = 100/20
Mean = 5
3. Find the mean of the first five whole numbers.
The first five whole numbers are 0, 1 , 2 , 3 , 4
Mean of first five whole numbers = (0+1+2+3+4)/5
Mean of first five whole numbers = 10/5
Mean of first five whole numbers = 2
4. A cricketer scores the following runs in eight innings:
58, 76, 40, 35, 46, 45, 0, 100.
Find the mean score.
Number of innings = 8
Mean score = (58+76+40+35+46+45+0+100)/8
Mean score = 400/8
Mean score = 50
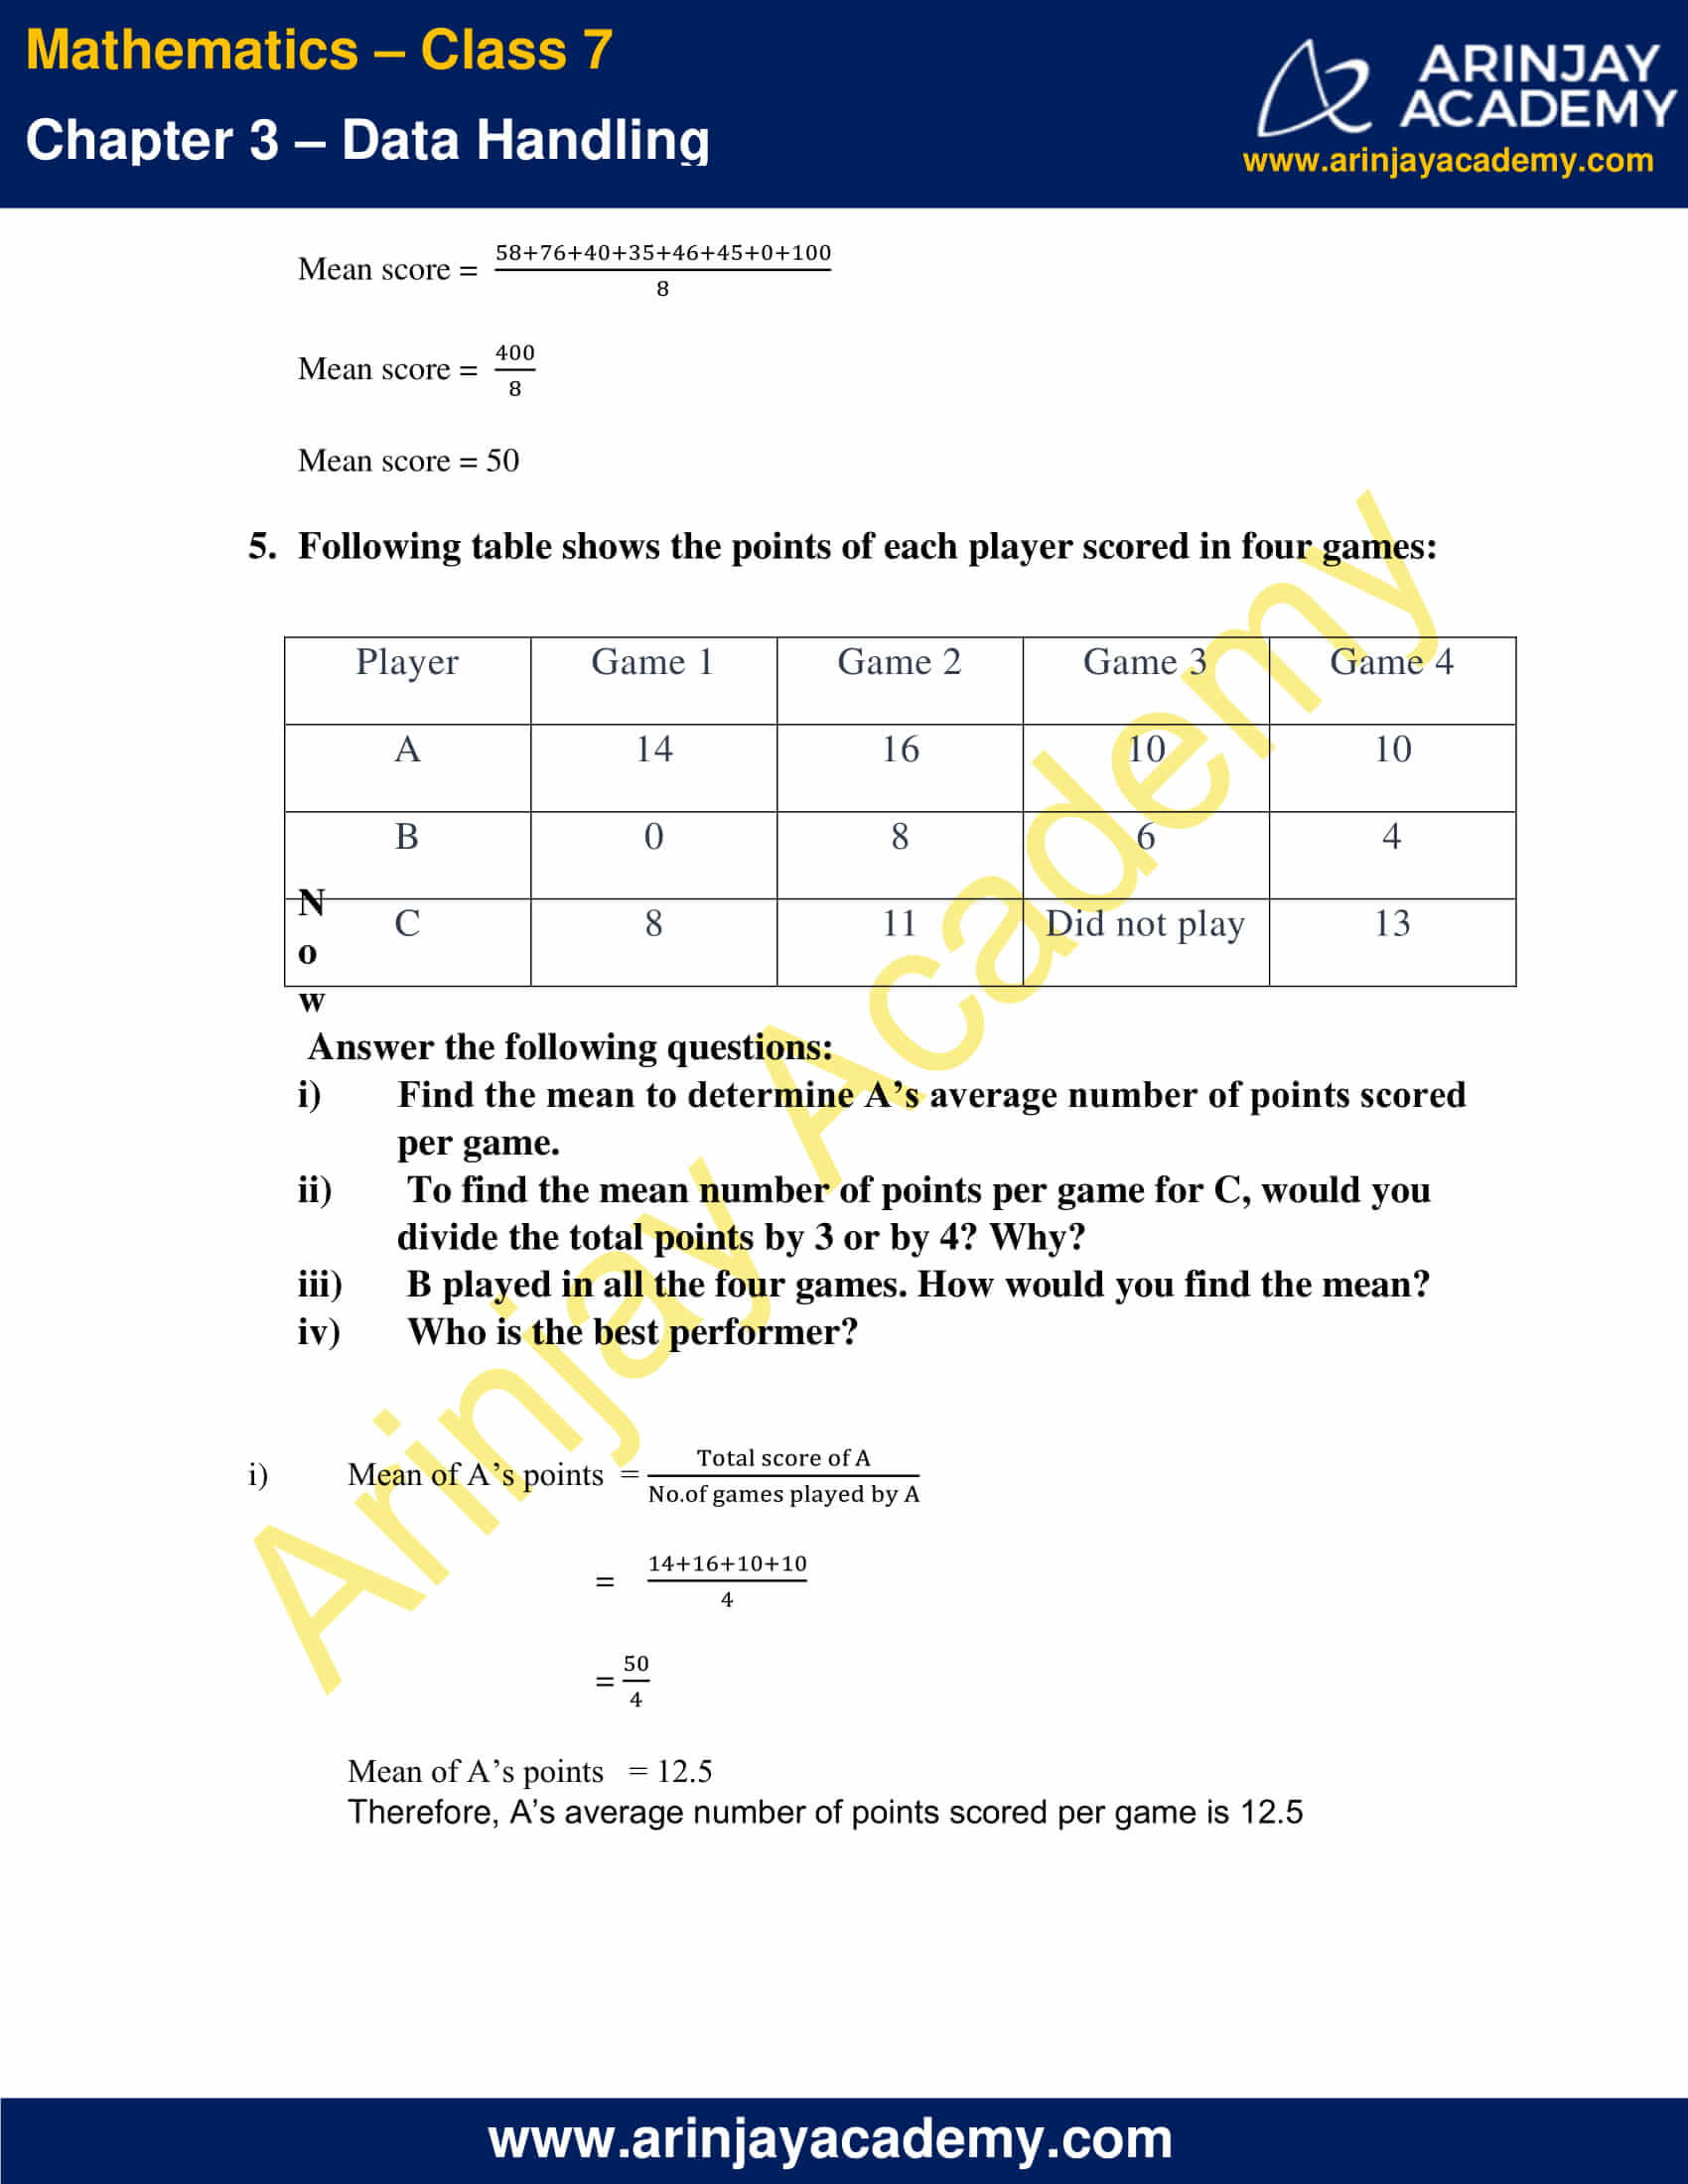
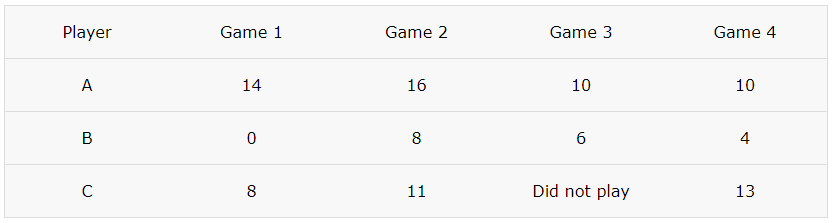
5. Following table shows the points of each player scored in four games:
Answer the following questions:
i) Find the mean to determine A’s average number of points scored per game.
ii) To find the mean number of points per game for C, would you divide the total points by 3 or by 4? Why?
iii) B played in all the four games. How would you find the mean?
iv) Who is the best performer?
i) Mean of A’s points = (Total score of A)/(No. of games played by A)
= (14+16+10+10)/4
= 50/4
Mean of A’s points = 12.5
Therefore, A’s average number of points scored per game is 12.5
ii) To find the mean number of points per game for C , divide the total points by 3 because C played only 3 games.
iii) Mean of B’s points = (Total score of B)/(No. of games played by B)
= (0+8+6+4)/4
= 18/4
Mean of B’s points = 4.5
iv) Comparing the mean score of A, B and C
Mean of A’s points = 12.5
Mean of B’s points = 4.5
Mean of C’s points = Total score of C/No. of games played by C
= (8+11+13)/3
= 32/3
Mean of C’s points = 10.67
On Comparing the mean score of A, B and C , we observe that the mean of A is more than that of B and C. Therefore, A is the best performer.
6. The marks (out of 100) obtained by a group of students in a science test are 85, 76, 90, 85, 39, 48, 56, 95, 81 and 75. Find the:
(i) Highest and the lowest marks obtained by the students.
(ii) Range of the marks obtained.
(iii) Mean marks obtained by the group.
i) Highest marks = 95
Lowest marks = 39
ii) Range of the marks = Highest marks – Lowest marks
= 95 – 39
= 56
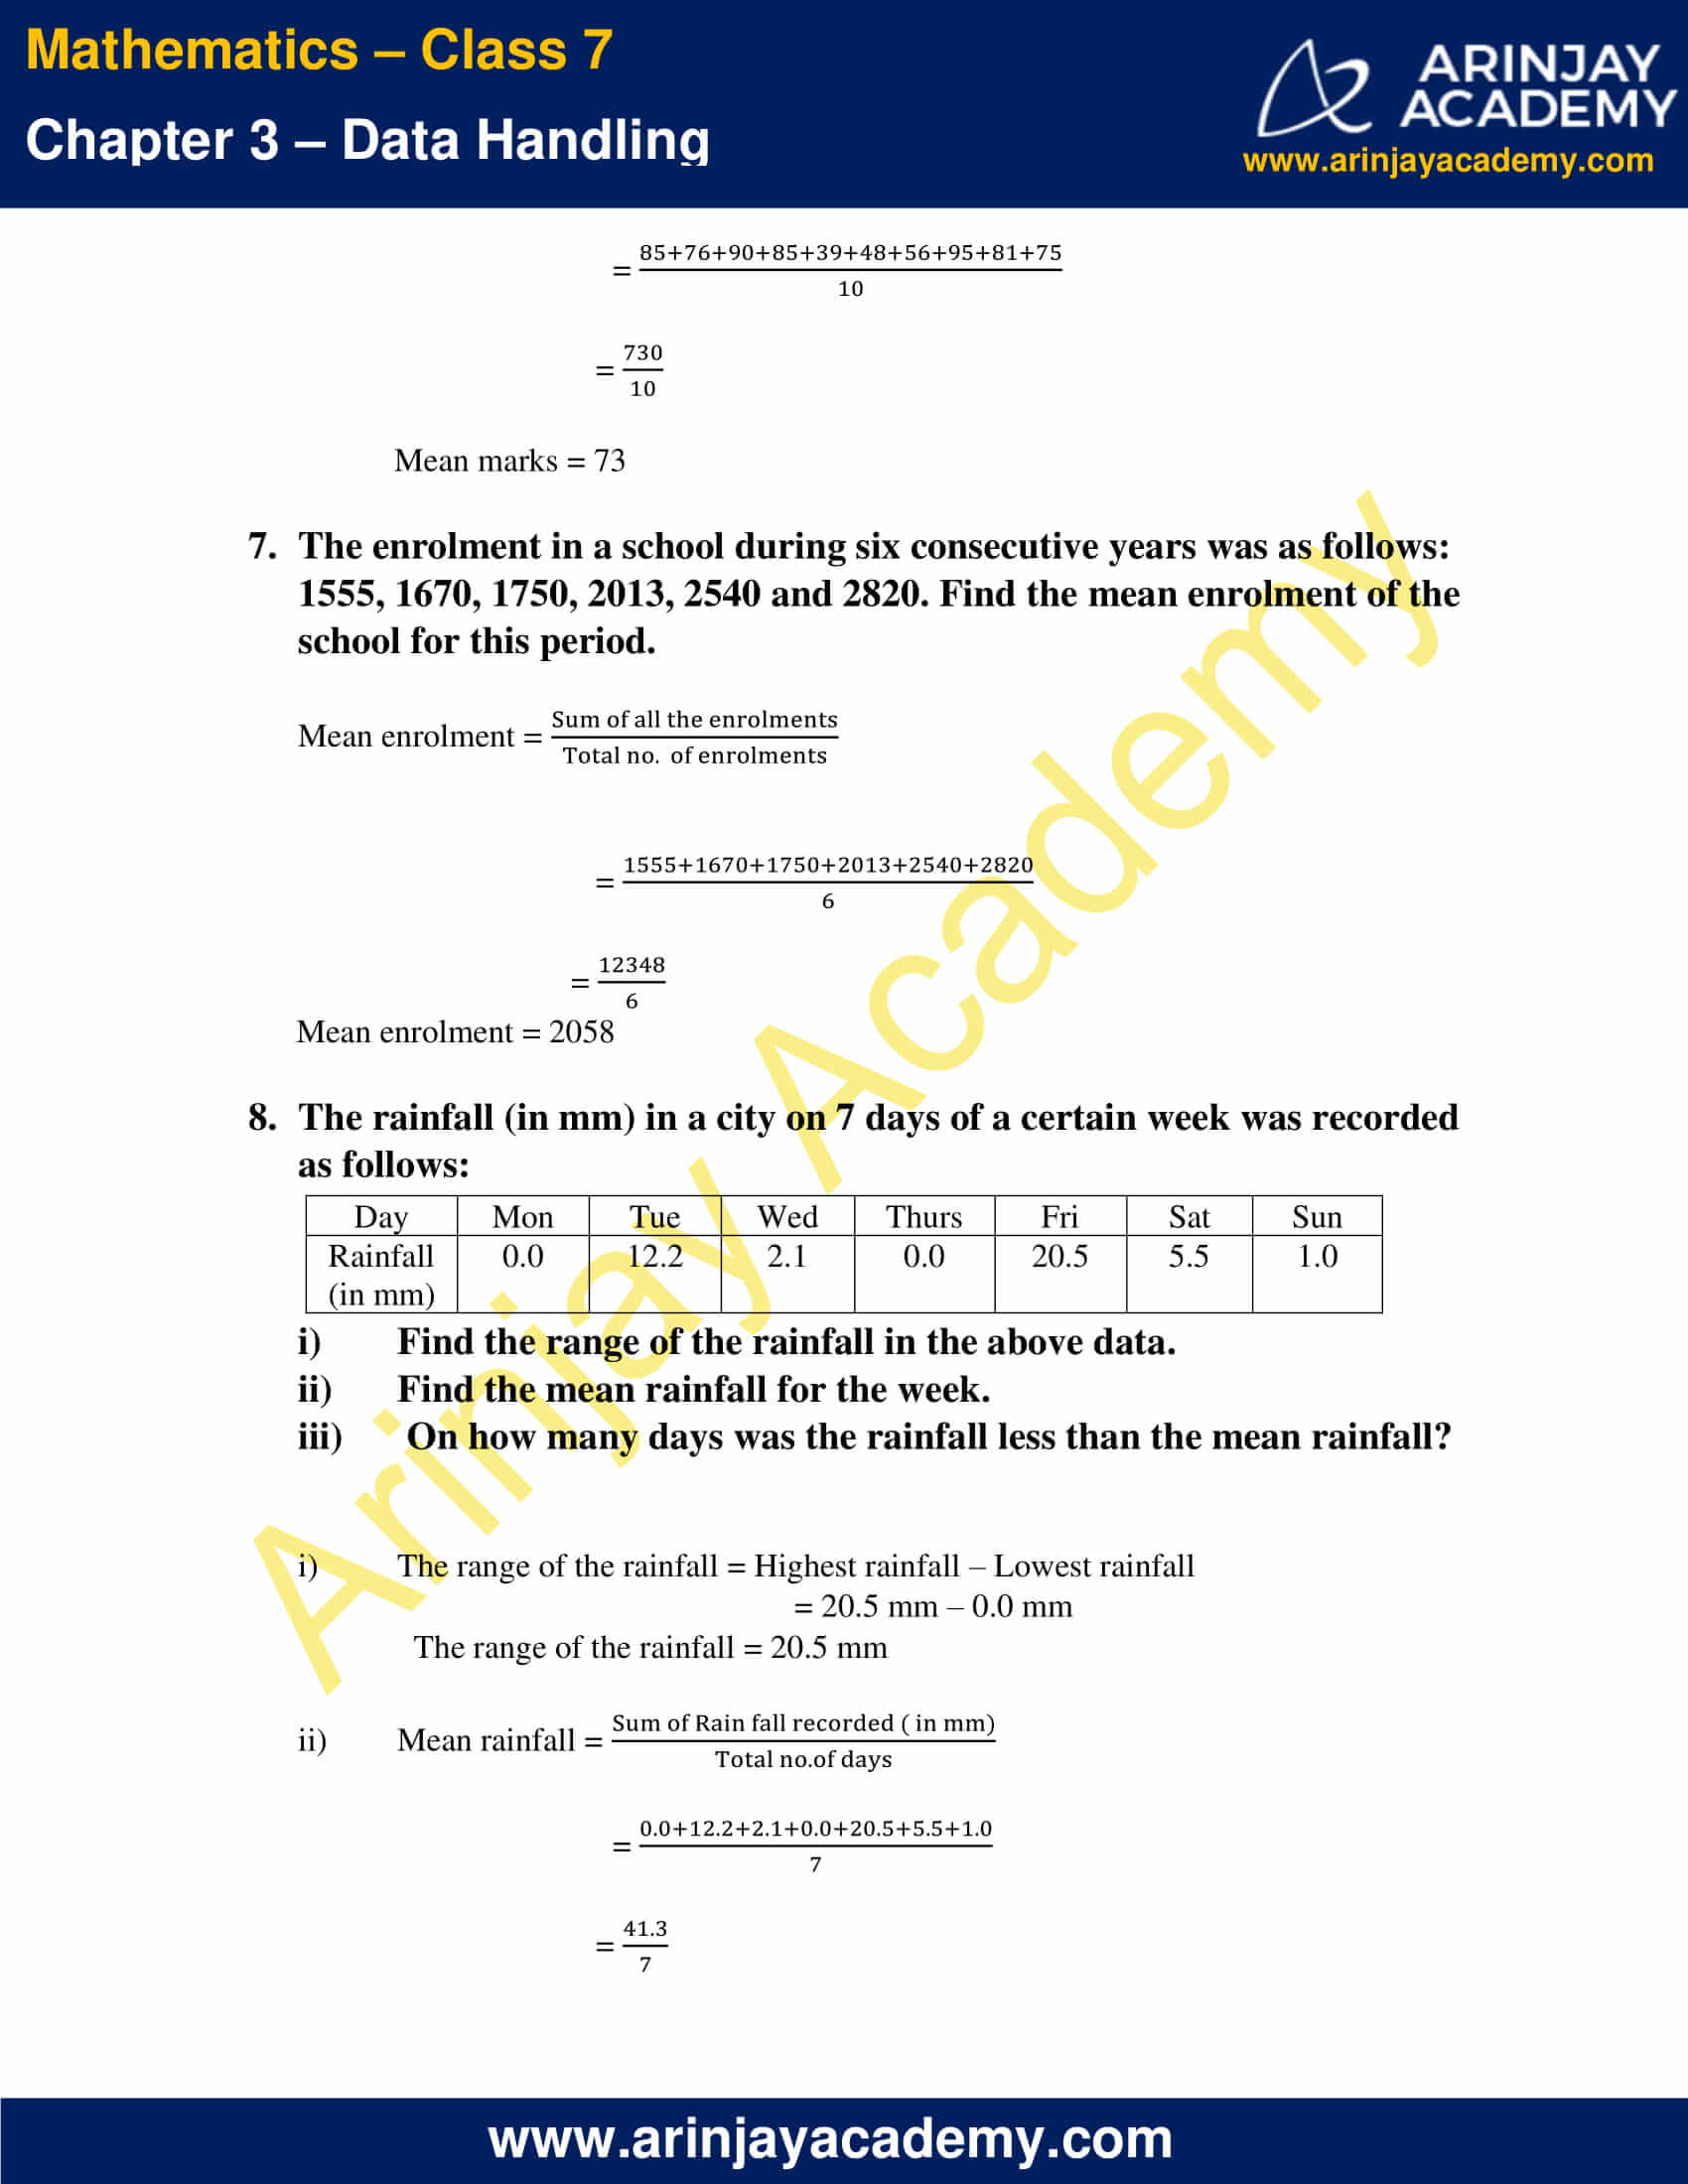
iii) Mean marks = Sum of marks/Total number of marks
= (85+76+90+85+39+48+56+95+81+75)/10
= 730/10
Mean marks = 73
7. The enrolment in a school during six consecutive years was as follows: 1555, 1670, 1750, 2013, 2540 and 2820. Find the mean enrolment of the school for this period.
Mean enrolment = (Sum of all the enrolments)/(Total no. of enrolments)
= (1555+1670+1750+2013+2540+2820)/6
= 12348/6
Mean enrolment = 2058
8. The rainfall (in mm) in a city on 7 days of a certain week was recorded as follows:
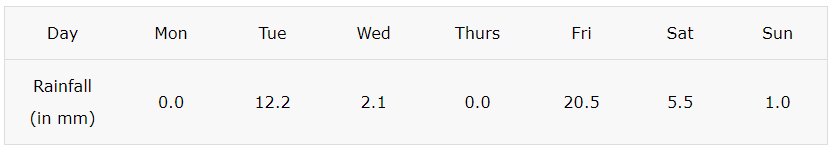
i) Find the range of the rainfall in the above data.
ii) Find the mean rainfall for the week.
iii) On how many days was the rainfall less than the mean rainfall?
i) The range of the rainfall = Highest rainfall – Lowest rainfall
= 20.5 mm – 0.0 mm
The range of the rainfall = 20.5 mm
ii) Mean rainfall = Sum of rainfall recorded (in mm)/Total no. of days
= (0.0+12.2+2.1+0.0+20.5+5.5+1.0)/7
= 41.3/7
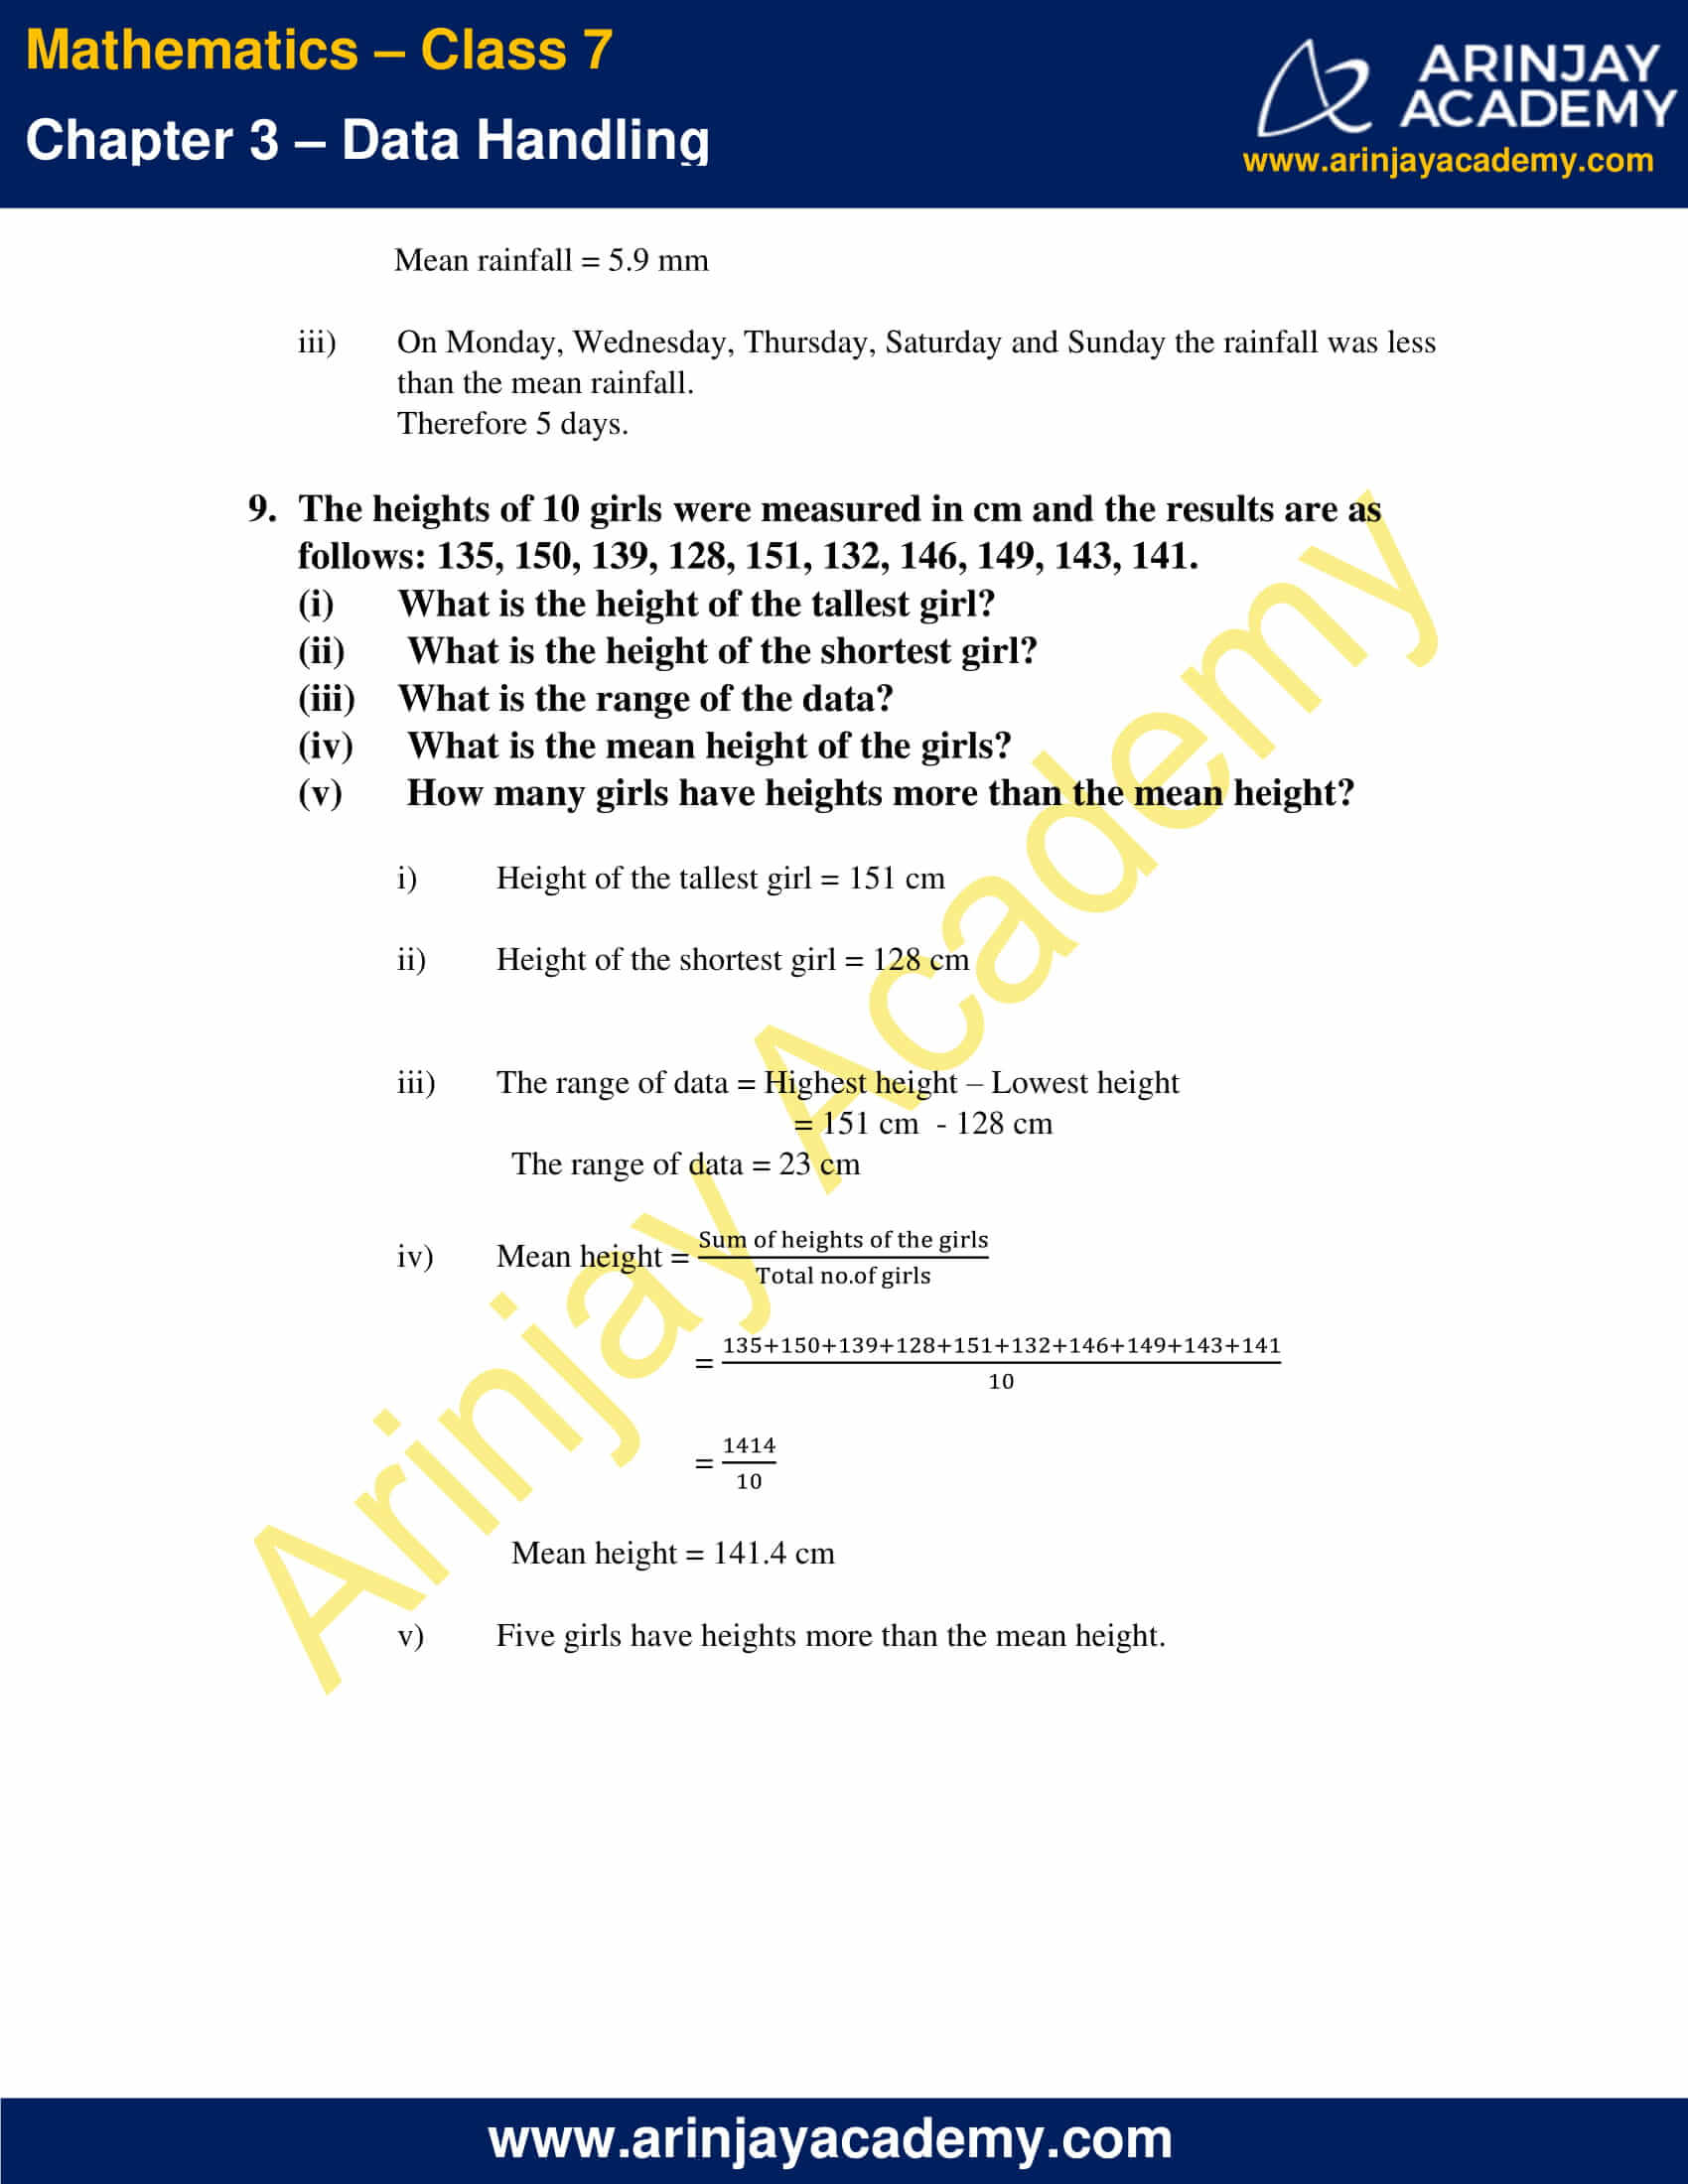
Mean rainfall = 5.9 mm
iii) On Monday, Wednesday, Thursday, Saturday and Sunday the rainfall was less than the mean rainfall.
Therefore 5 days.
9. The heights of 10 girls were measured in cm and the results are as follows: 135, 150, 139, 128, 151, 132, 146, 149, 143, 141.
(i) What is the height of the tallest girl?
(ii) What is the height of the shortest girl?
(iii) What is the range of the data?
(iv) What is the mean height of the girls?
(v) How many girls have heights more than the mean height?
i) Height of the tallest girl = 151 cm
ii) Height of the shortest girl = 128 cm
iii) The range of data = Highest height – Lowest height
= 151 cm – 128 cm
The range of data = 23 cm
(iv) Mean height = (Sum of heights of the girls)/(Total number of girls)
= (135+150+139+128+151+132+146+149+143+141)/10
= 1414/10
Mean height = 141.4 cm
(v) Five girls have heights more than the mean height.
NCERT Solutions for Class 7 Maths Chapter 3 Exercise 3.2 – Data Handling
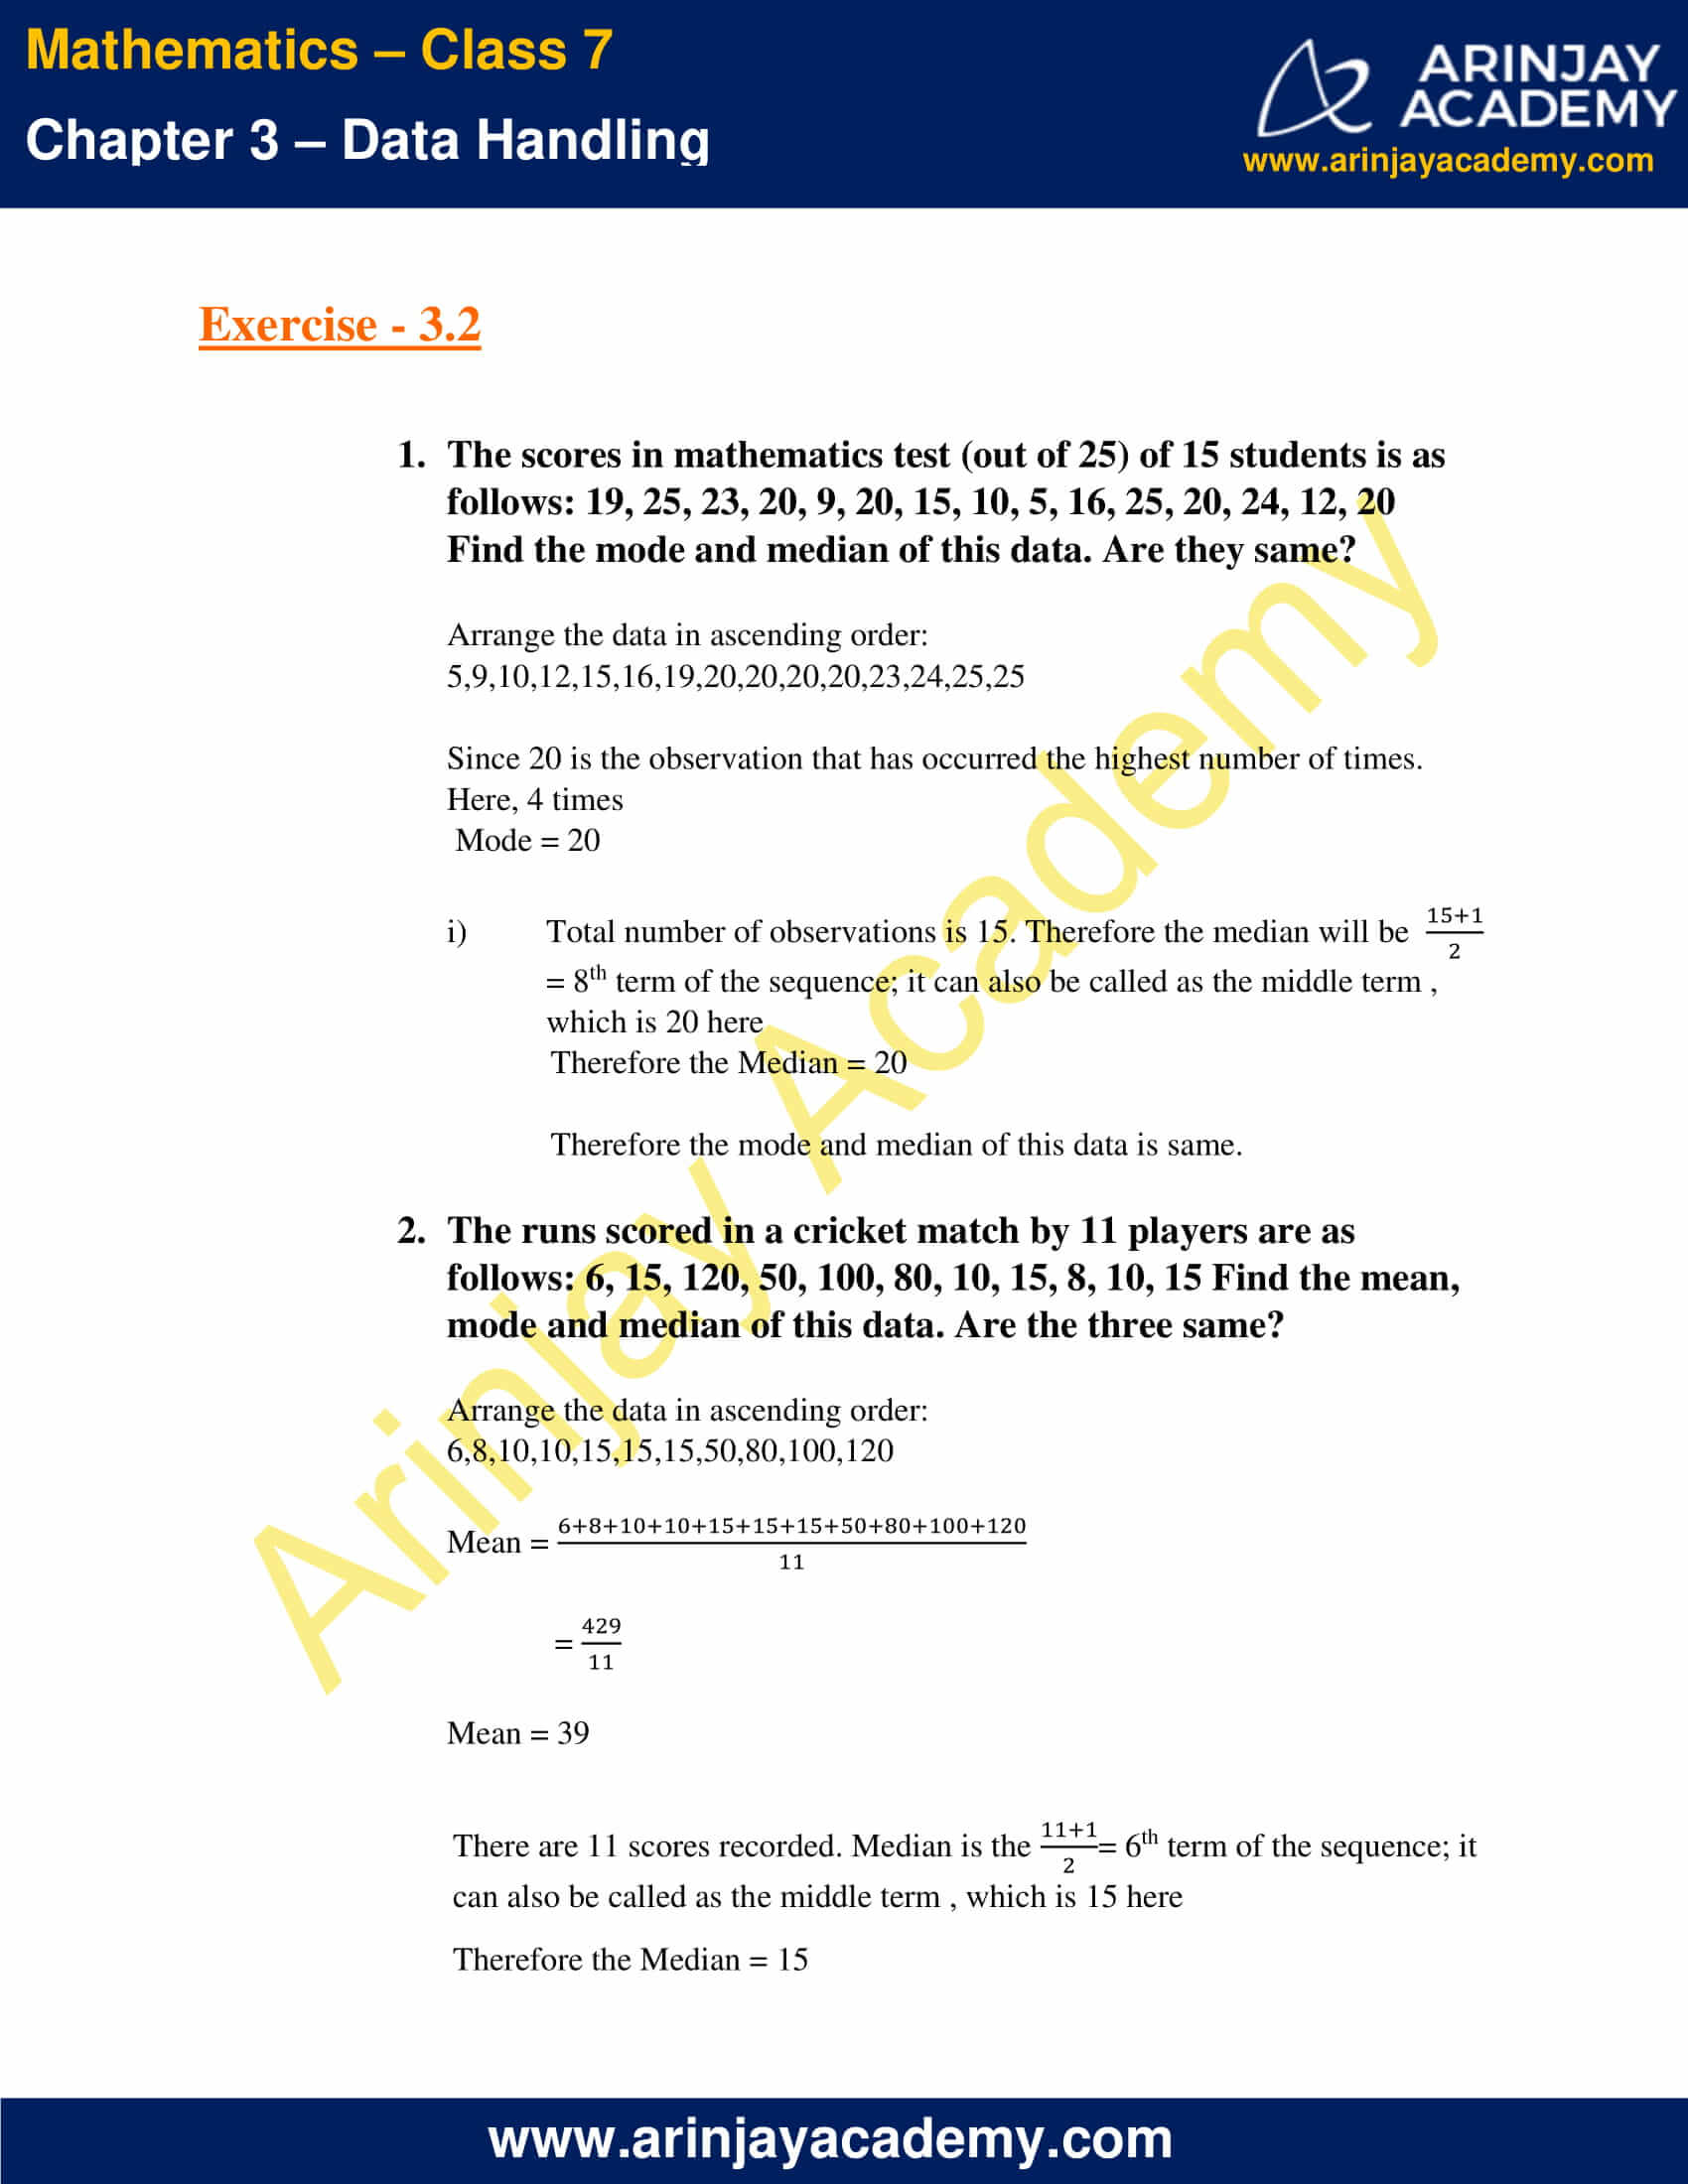
1. The scores in mathematics test (out of 25) of 15 students is as follows: 19, 25, 23, 20, 9, 20, 15, 10, 5, 16, 25, 20, 24, 12, 20
Find the mode and median of this data. Are they same?
Arrange the data in ascending order:
5,9,10,12,15,16,19,20,20,20,20,23,24,25,25
Since 20 is the observation that has occurred the highest number of times. Here, 4 times
Mode = 20
Total number of observations is 15. Therefore the median will be (15+1)/2 = 8th term of the sequence; it can also be called as the middle term , which is 20 here
Therefore the Median = 20
Therefore the mode and median of this data is same.
2. The runs scored in a cricket match by 11 players are as follows: 6, 15, 120, 50, 100, 80, 10, 15, 8, 10, 15 Find the mean, mode and median of this data. Are the three same?
Arrange the data in ascending order:
6,8,10,10,15,15,15,50,80,100,120
Mean = (6+8+10+10+15+15+15+50+80+100+120)/11
= 429/11
Mean = 39
There are 11 scores recorded. Median is the (11+1)/2 = 6th term of the sequence; it can also be called as the middle term , which is 15 here
Therefore the Median = 15
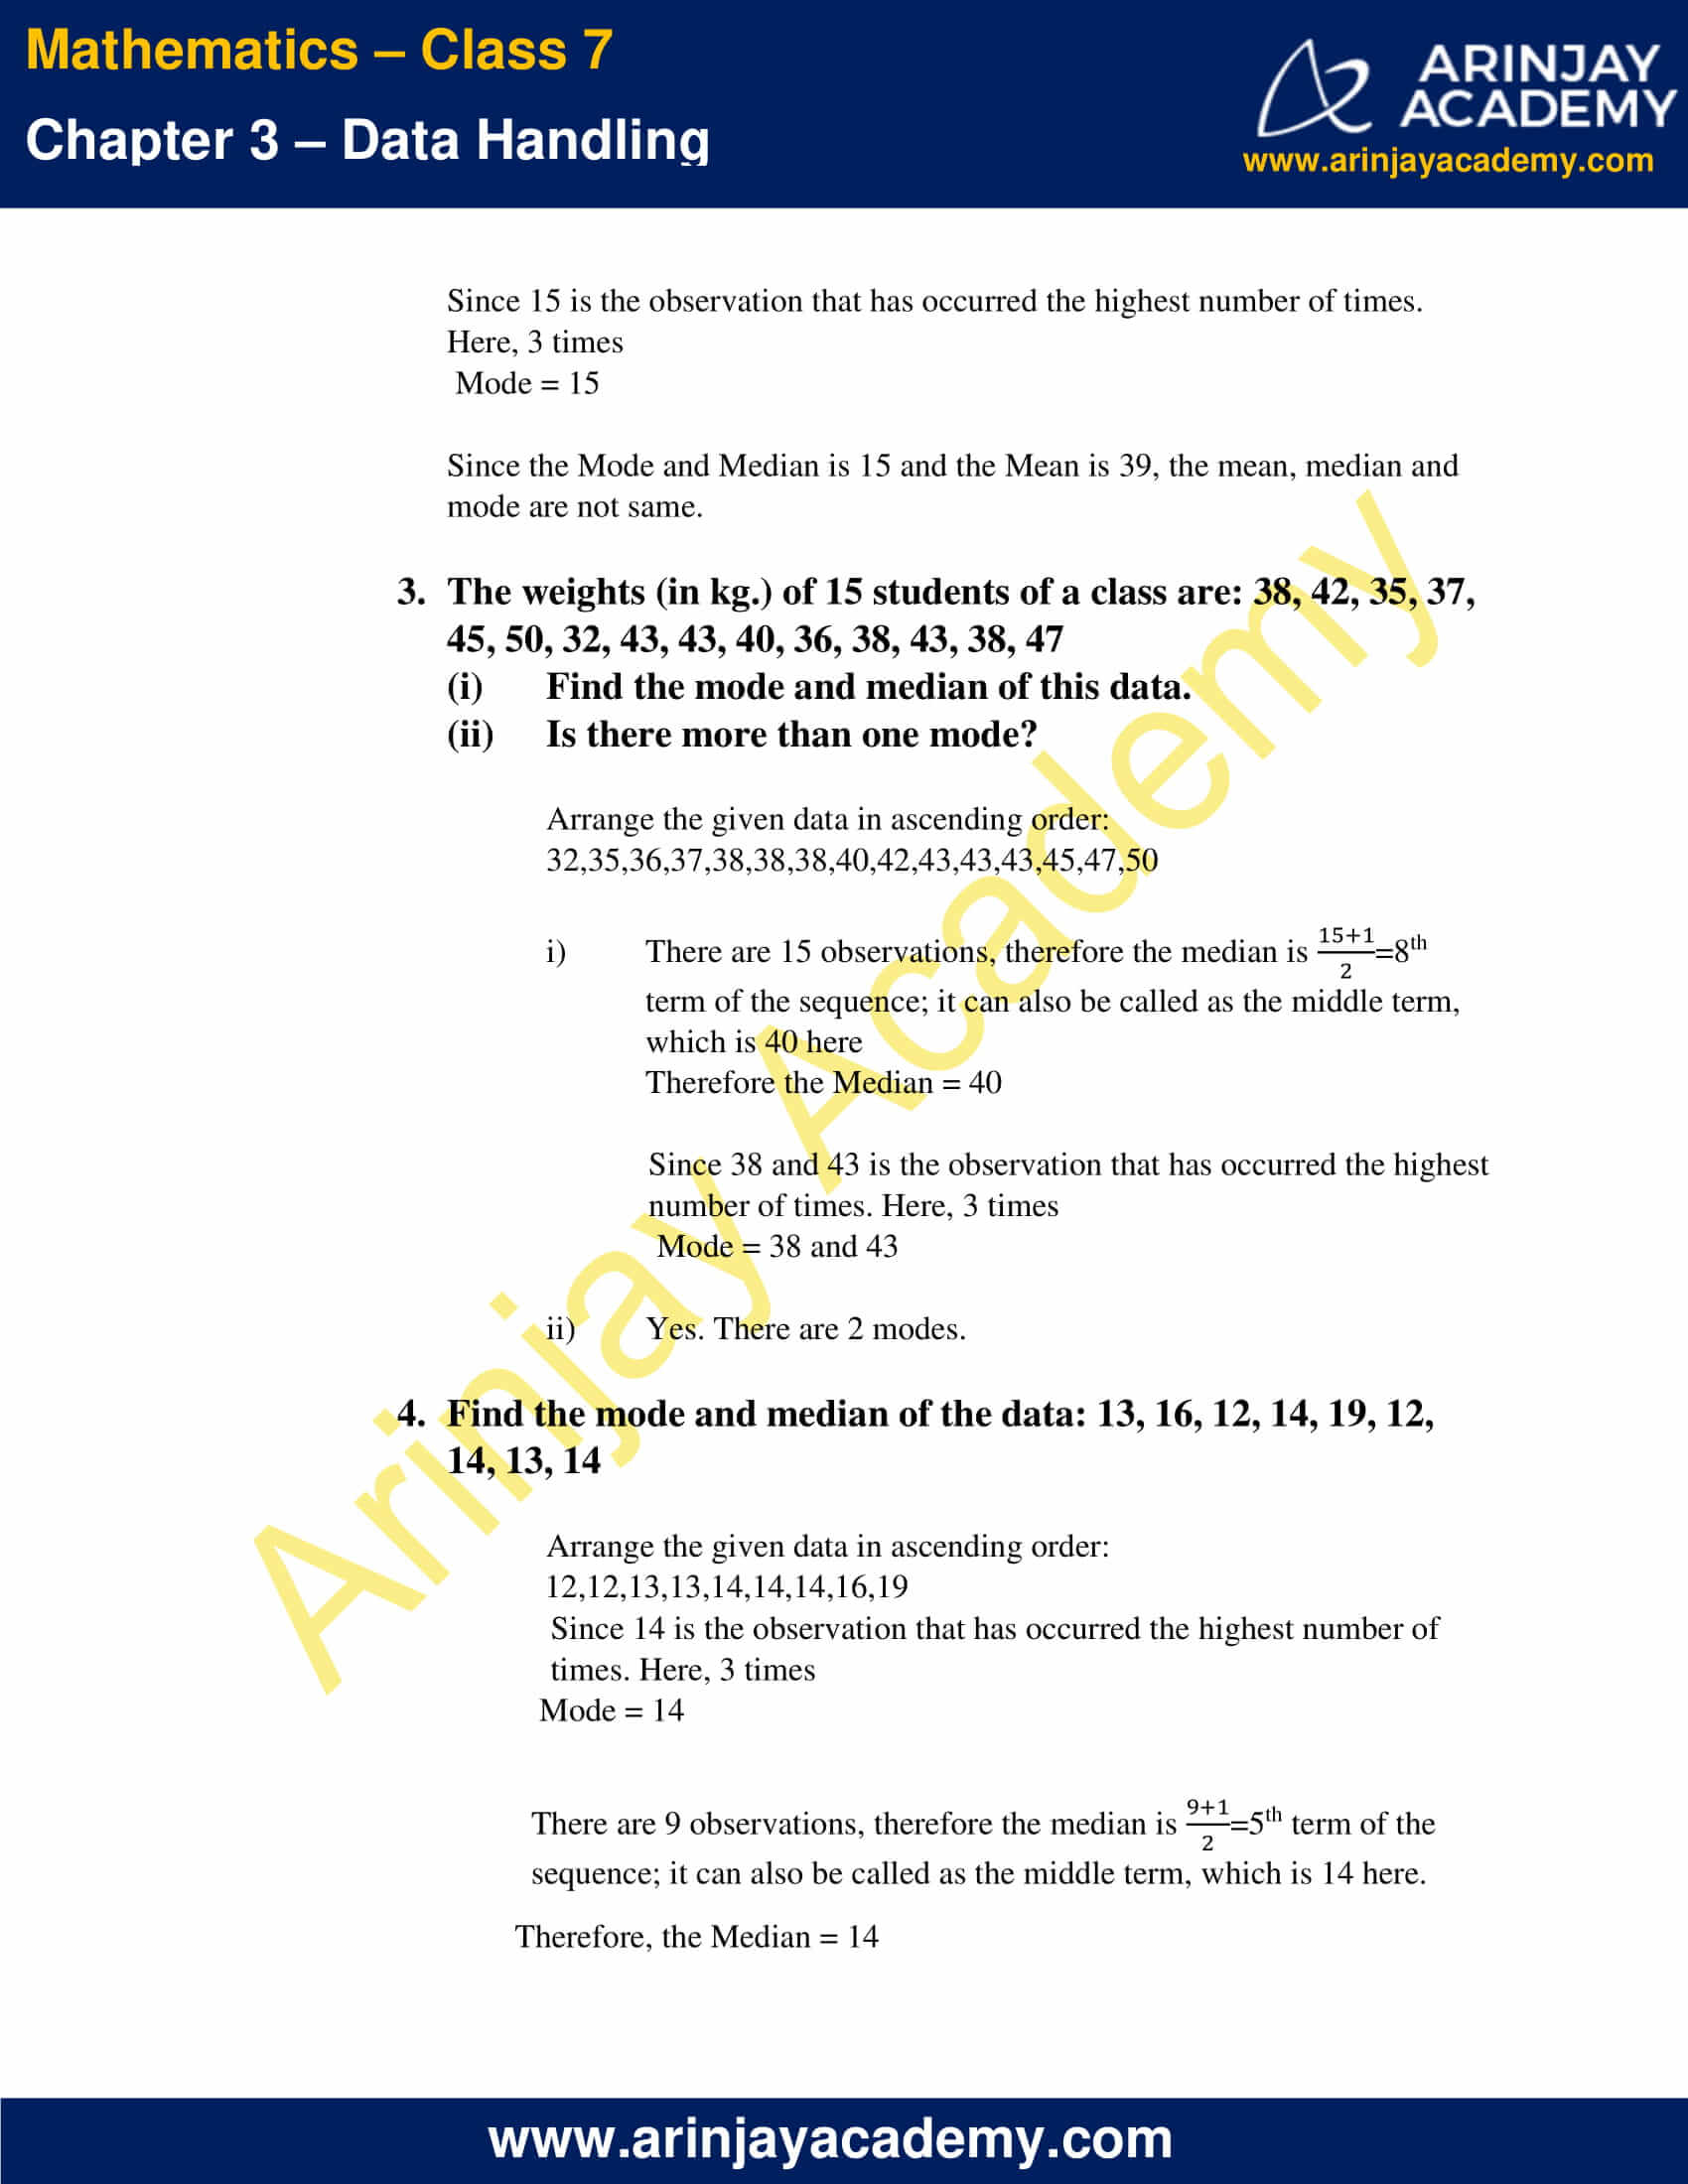
Since 15 is the observation that has occurred the highest number of times. Here, 3 times
Mode = 15
Since the Mode and Median is 15 and the Mean is 39, the mean, median and mode are not same.
3. The weights (in kg.) of 15 students of a class are: 38, 42, 35, 37, 45, 50, 32, 43, 43, 40, 36, 38, 43, 38, 47
(i) Find the mode and median of this data.
(ii) Is there more than one mode?
Arrange the given data in ascending order:
32,35,36,37,38,38,38,40,42,43,43,43,45,47,50
(i) There are 15 observations, therefore the median is (15+1)/2 =8th term of the sequence; it can also be called as the middle term, which is 40 here
Therefore the Median = 40
Since 38 and 43 is the observation that has occurred the highest number of times. Here, 3 times
Mode = 38 and 43
(ii) There are 2 modes.
4. Find the mode and median of the data: 13, 16, 12, 14, 19, 12, 14, 13, 14
Arrange the given data in ascending order:
12,12,13,13,14,14,14,16,19
Since 14 is the observation that has occurred the highest number of times. Here, 3 times
Mode = 14
There are 9 observations, therefore the median is (9+1)/2 = 5th term of the sequence; it can also be called as the middle term, which is 14 here.
Therefore, the Median = 14
5. Tell whether the statement is true or false:
(i) The mode is always one of the numbers in a data.
(ii) The mean is one of the numbers in a data.
(iii) The median is always one of the numbers in a data.
(iv) The data 6, 4, 3, 8, 9, 12, 13, 9 has mean 9.
(i) True
Since the mode of a set of observations is the observation that occurs most often, it is one of the observations in the given data.
(ii) False
Mean is the ratio of sum of all the values to the total number of values in the data. It may or may not be one of the numbers in the data, but it will lie in the range. More generally speaking, it is the average value.
(iii) True
Since the median gives us the middle observation of the given data arranged in ascending order, it is always one of the numbers in the data.
iv) False
Mean = (6+4+3+8+9+12+13+9)/8
= 64/8
Mean = 8 ≠ 9
NCERT Solutions for Class 7 Maths Chapter 3 Exercise 3.3 – Data Handling
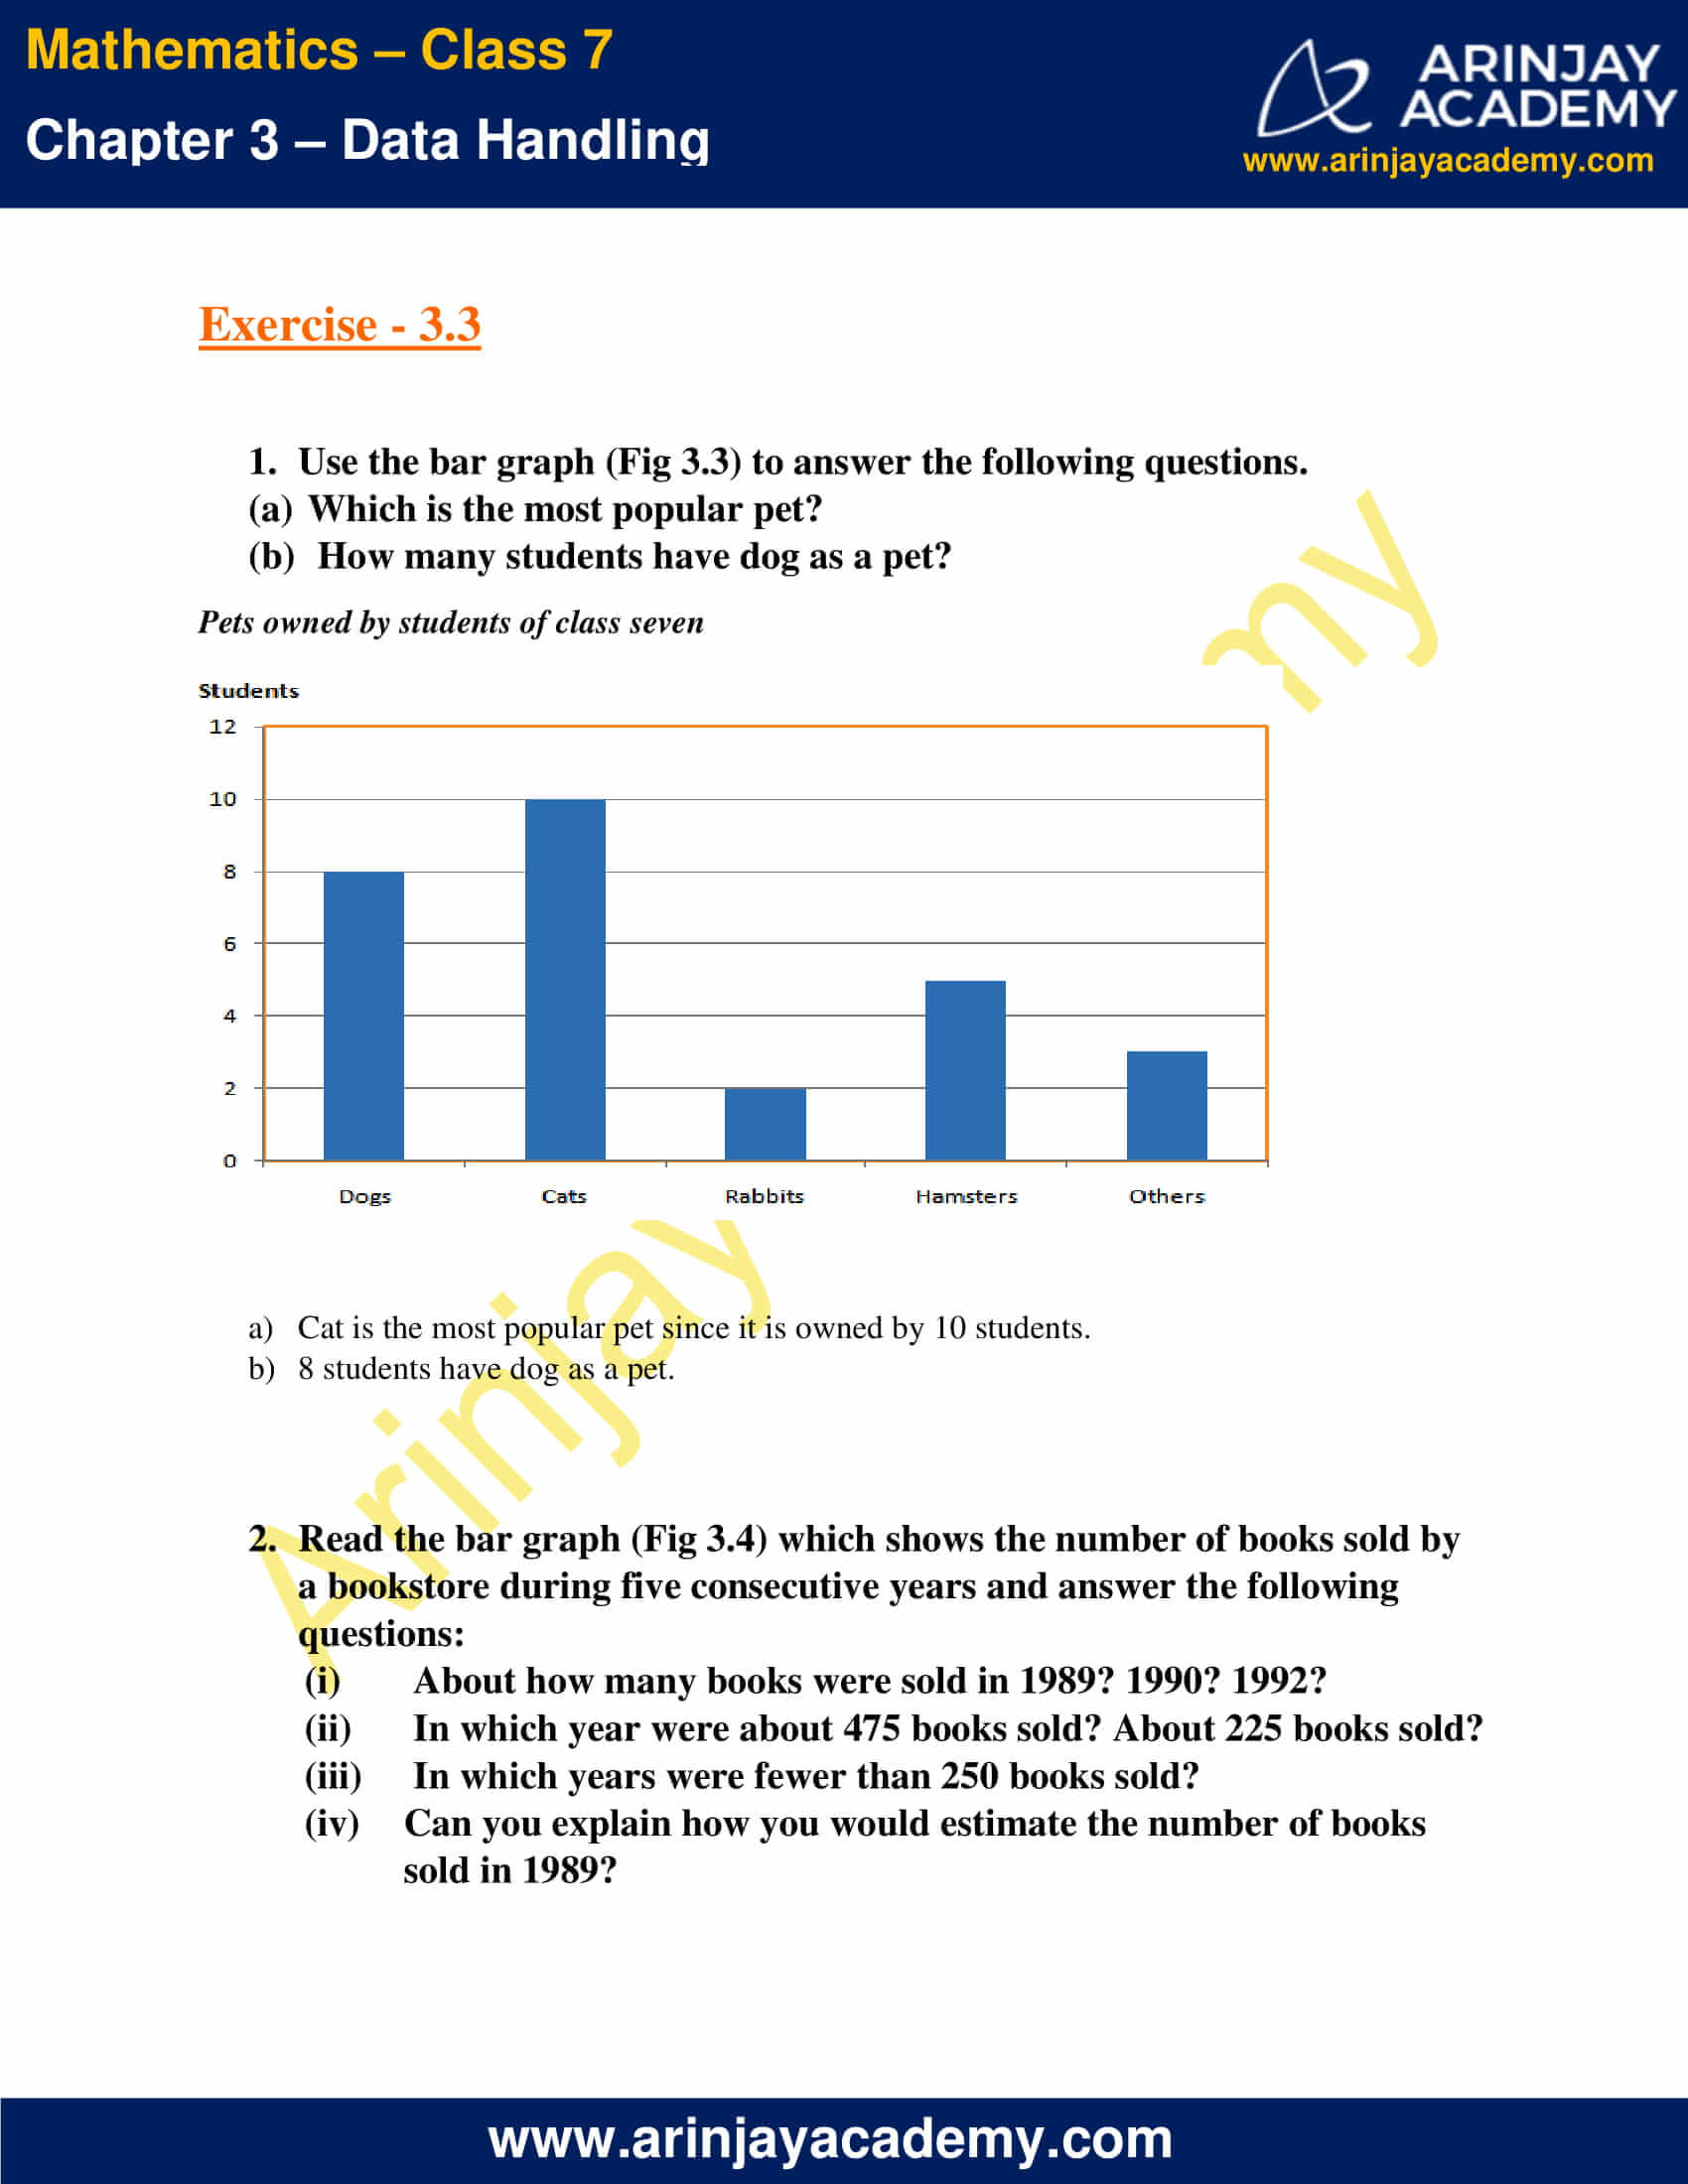
1. Use the bar graph (Fig 3.3) to answer the following questions.
(a) Which is the most popular pet?
(b) How many students have dog as a pet?
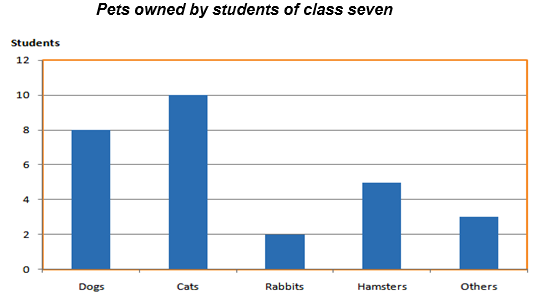
(a) Cat is the most popular pet since it is owned by 10 students.
(b) 8 students have dog as a pet.
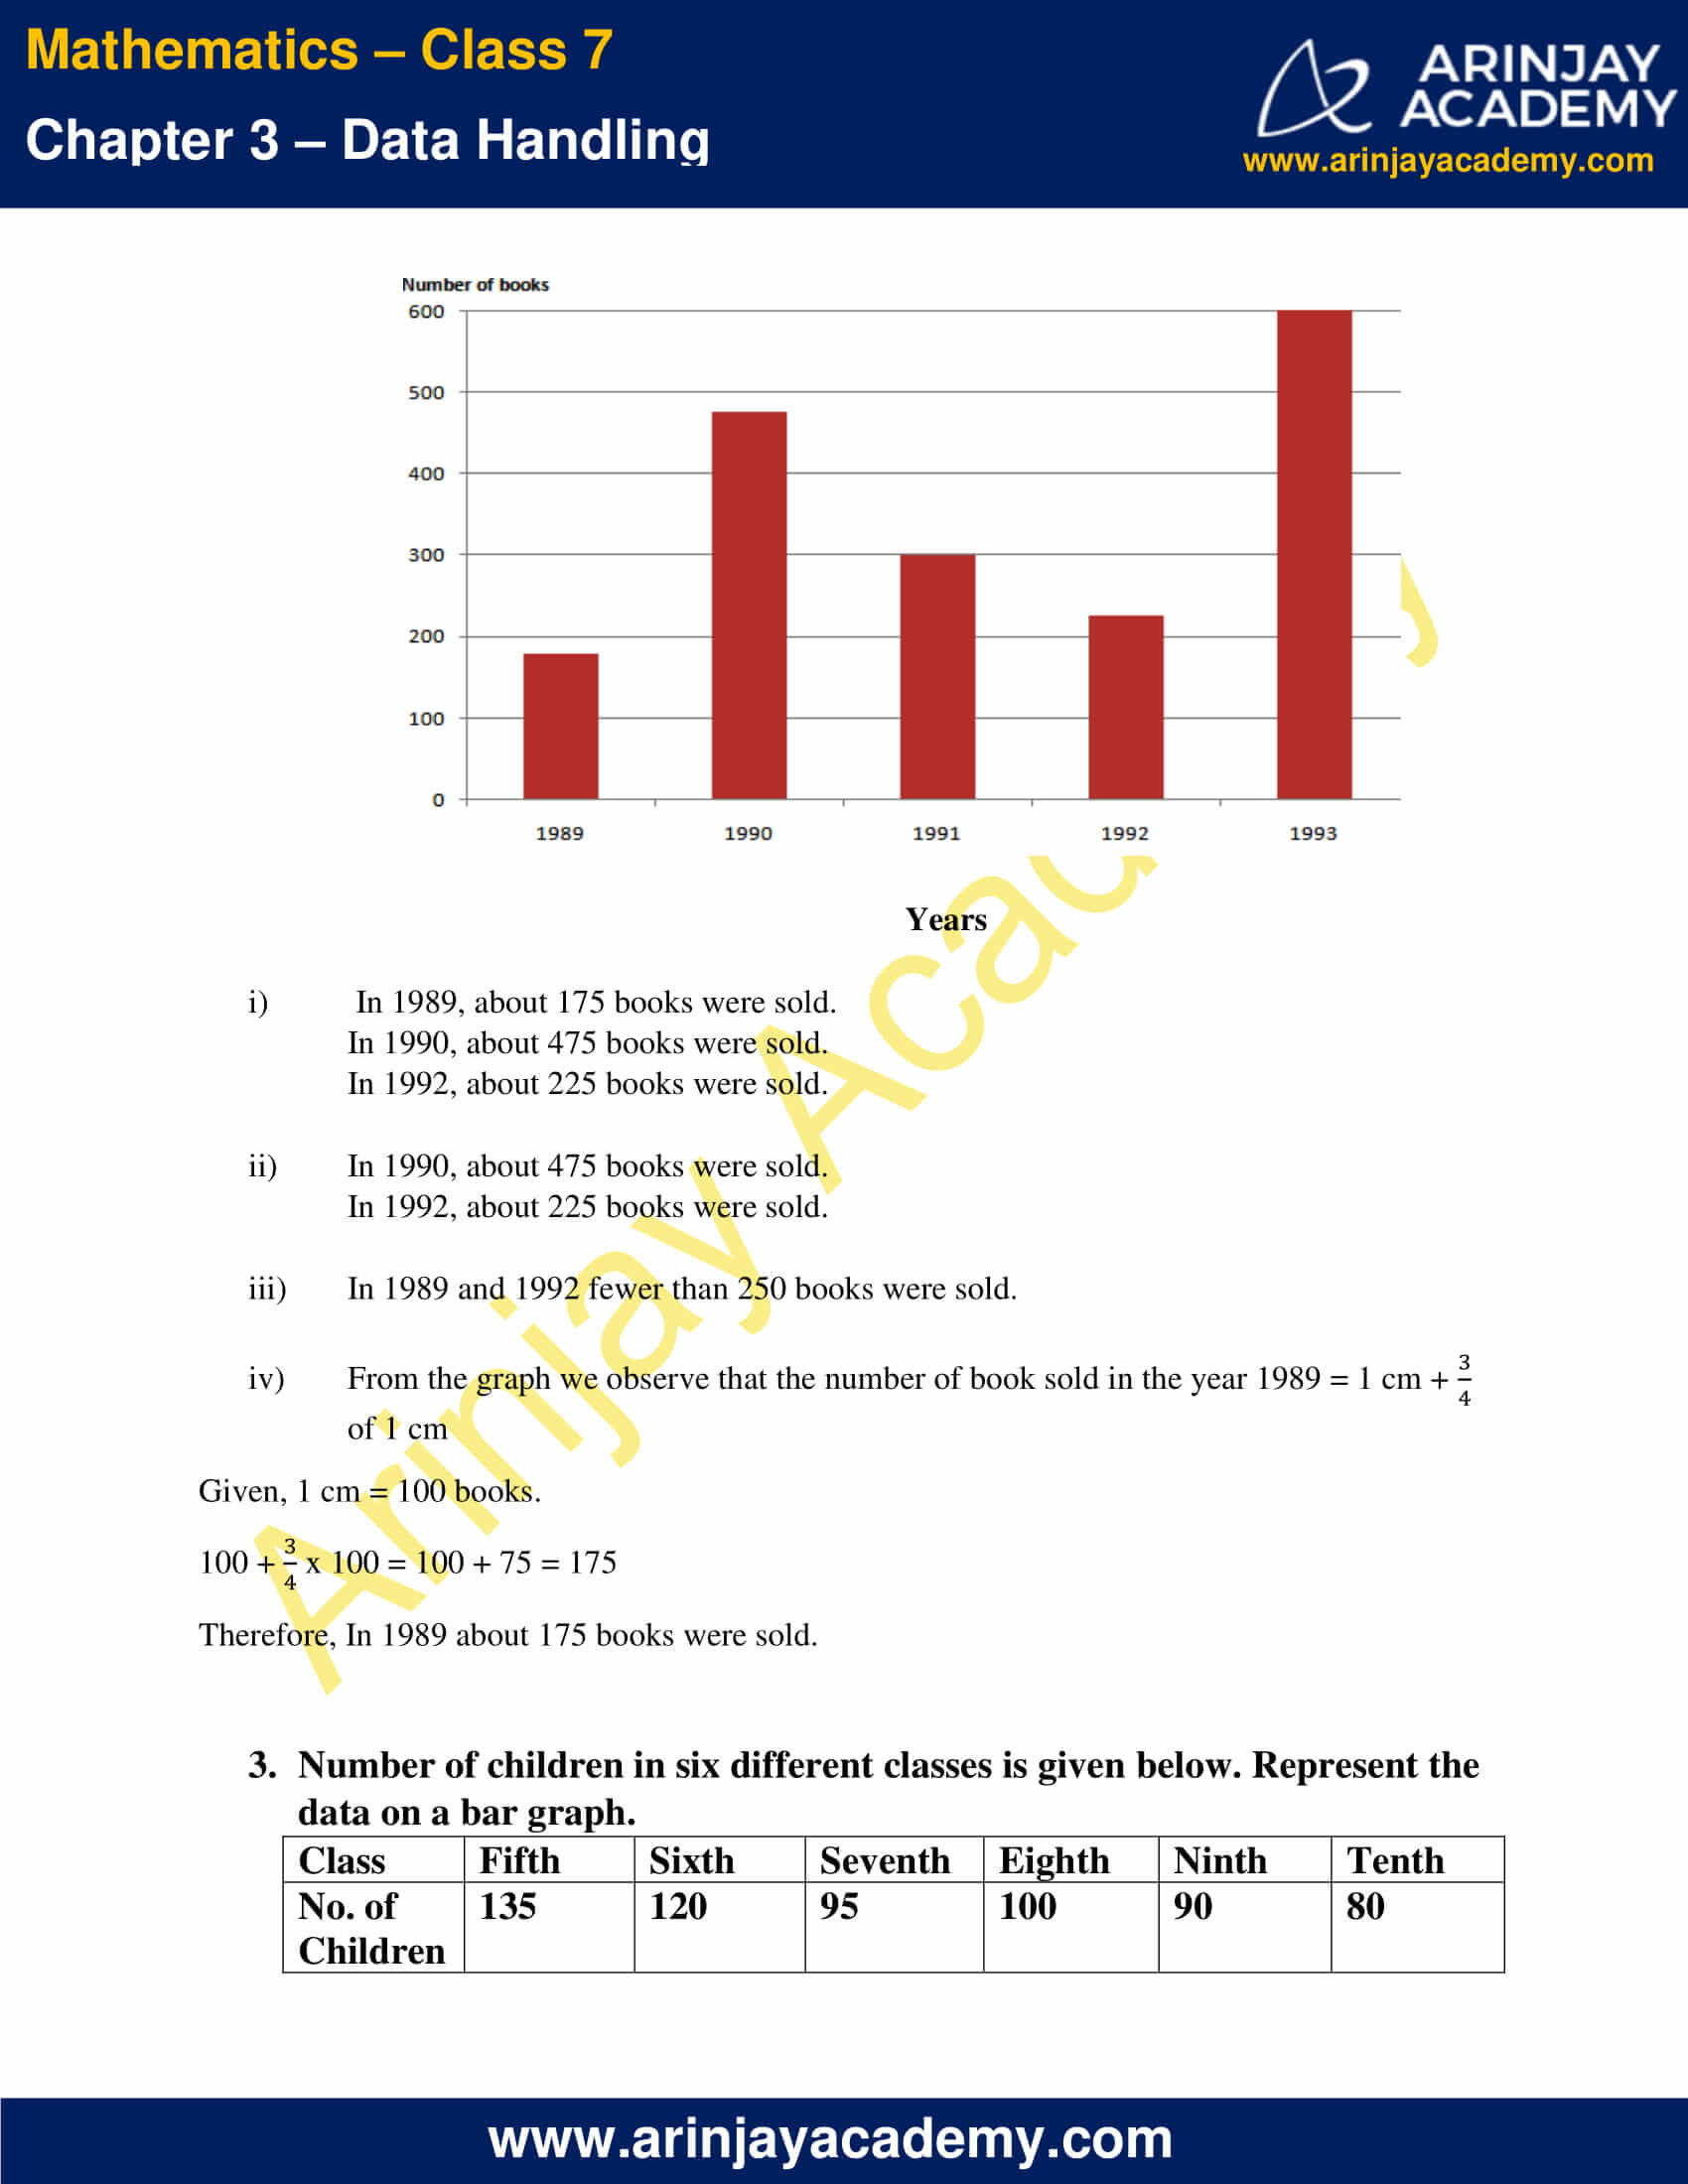
2. Read the bar graph (Fig 3.4) which shows the number of books sold by a bookstore during five consecutive years and answer the following questions:
(i) About how many books were sold in 1989? 1990? 1992?
(ii) In which year were about 475 books sold? About 225 books sold?
(iii) In which years were fewer than 250 books sold?
(iv) Can you explain how you would estimate the number of books sold in 1989?
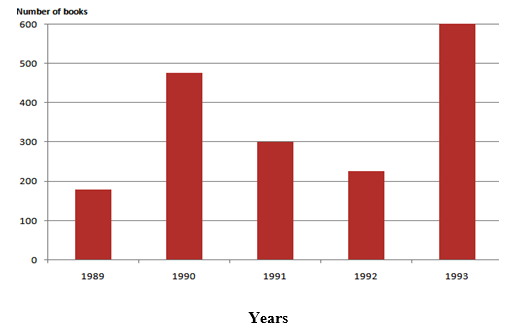
i) In 1989, about 175 books were sold.
In 1990, about 475 books were sold.
In 1992, about 225 books were sold.
ii) In 1990, about 475 books were sold.
In 1992, about 225 books were sold.
iii) In 1989 and 1992 fewer than 250 books were sold.
iv) From the graph we observe that the number of book sold in the year 1989 = 1 cm + 3/4 of 1 cm
Given, 1 cm = 100 books.
100 + 3/4 x 100 = 100 + 75 = 175
Therefore, In 1989 about 175 books were sold.
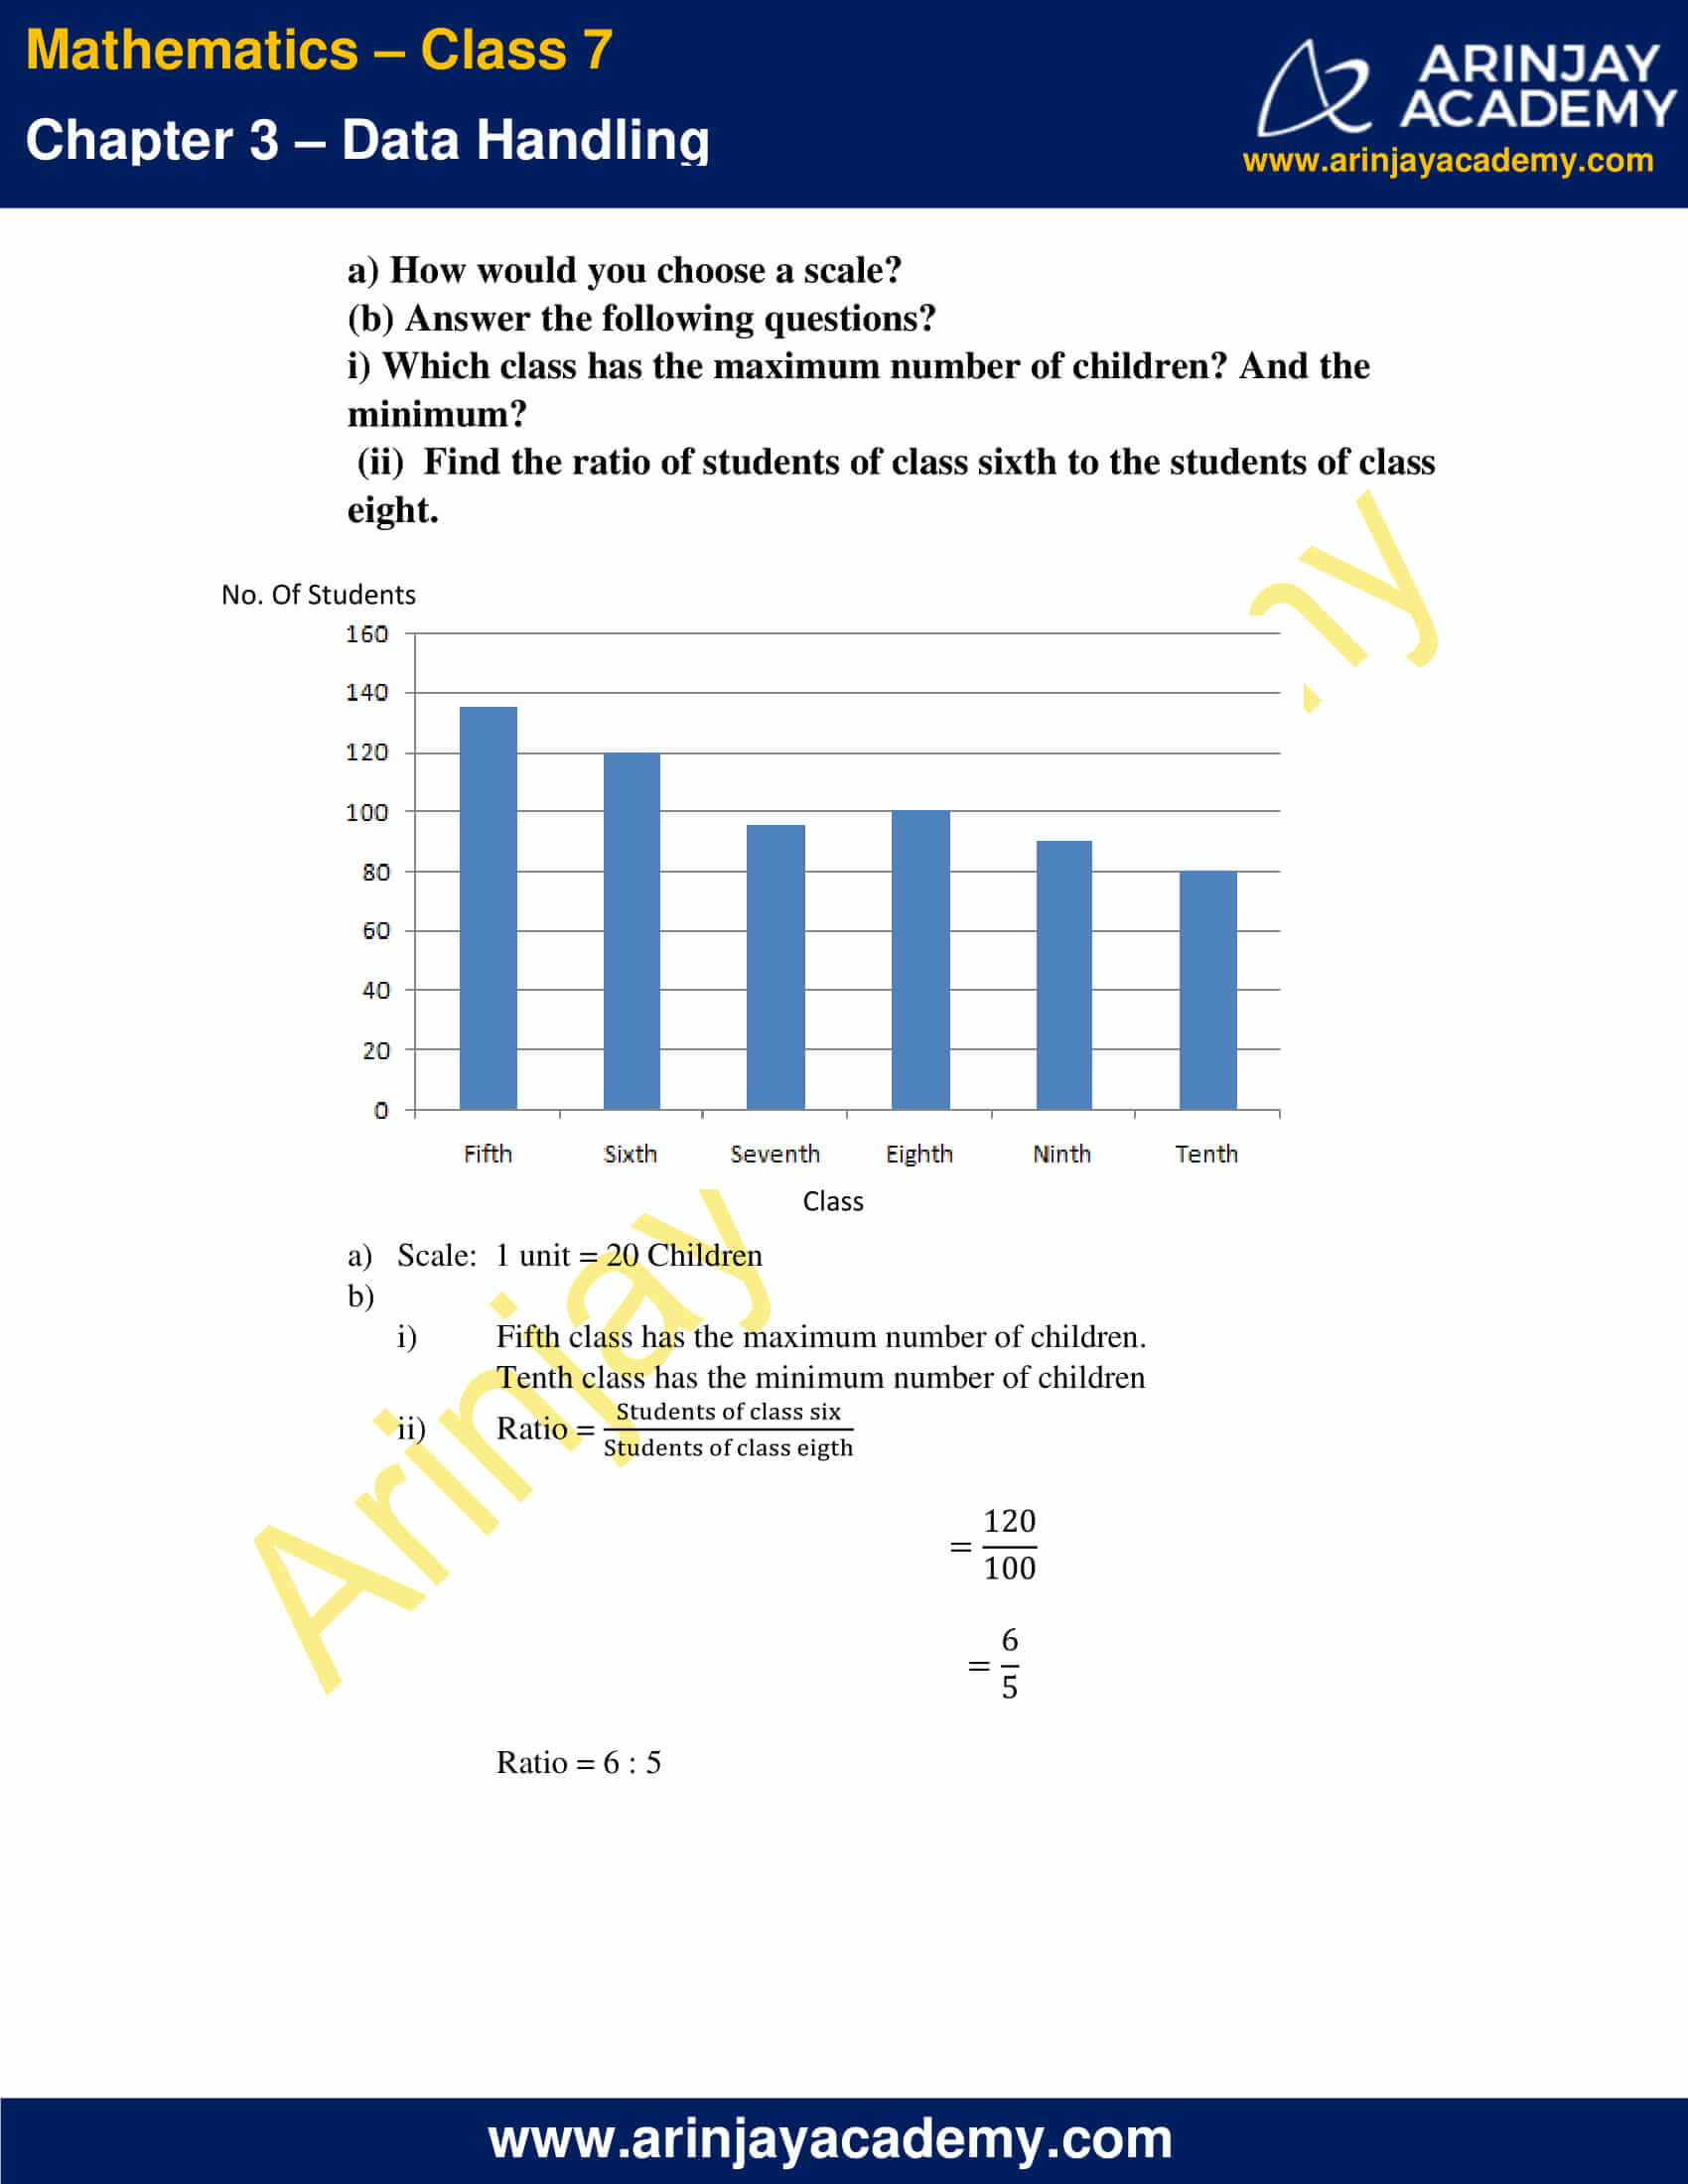
3. Number of children in six different classes is given below. Represent the data on a bar graph.
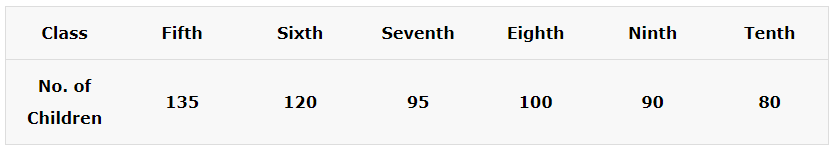
(a) How would you choose a scale?
(b) Answer the following questions?
(i) Which class has the maximum number of children? And the minimum?
(ii) Find the ratio of students of class sixth to the students of class eight.
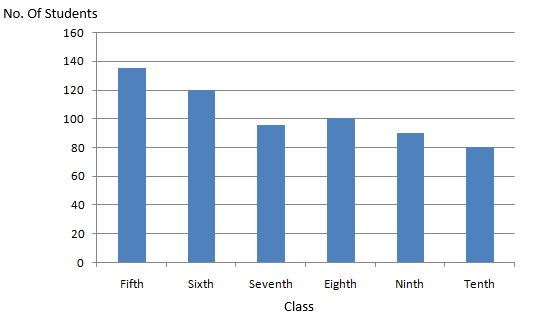
a) Scale: 1 unit = 20 Children
b)
(i) Fifth class has the maximum number of children.
Tenth class has the minimum number of children
(ii) Ratio = Students of class six/Students of class eight
= 120/100
= 6/5
Ratio = 6 : 5
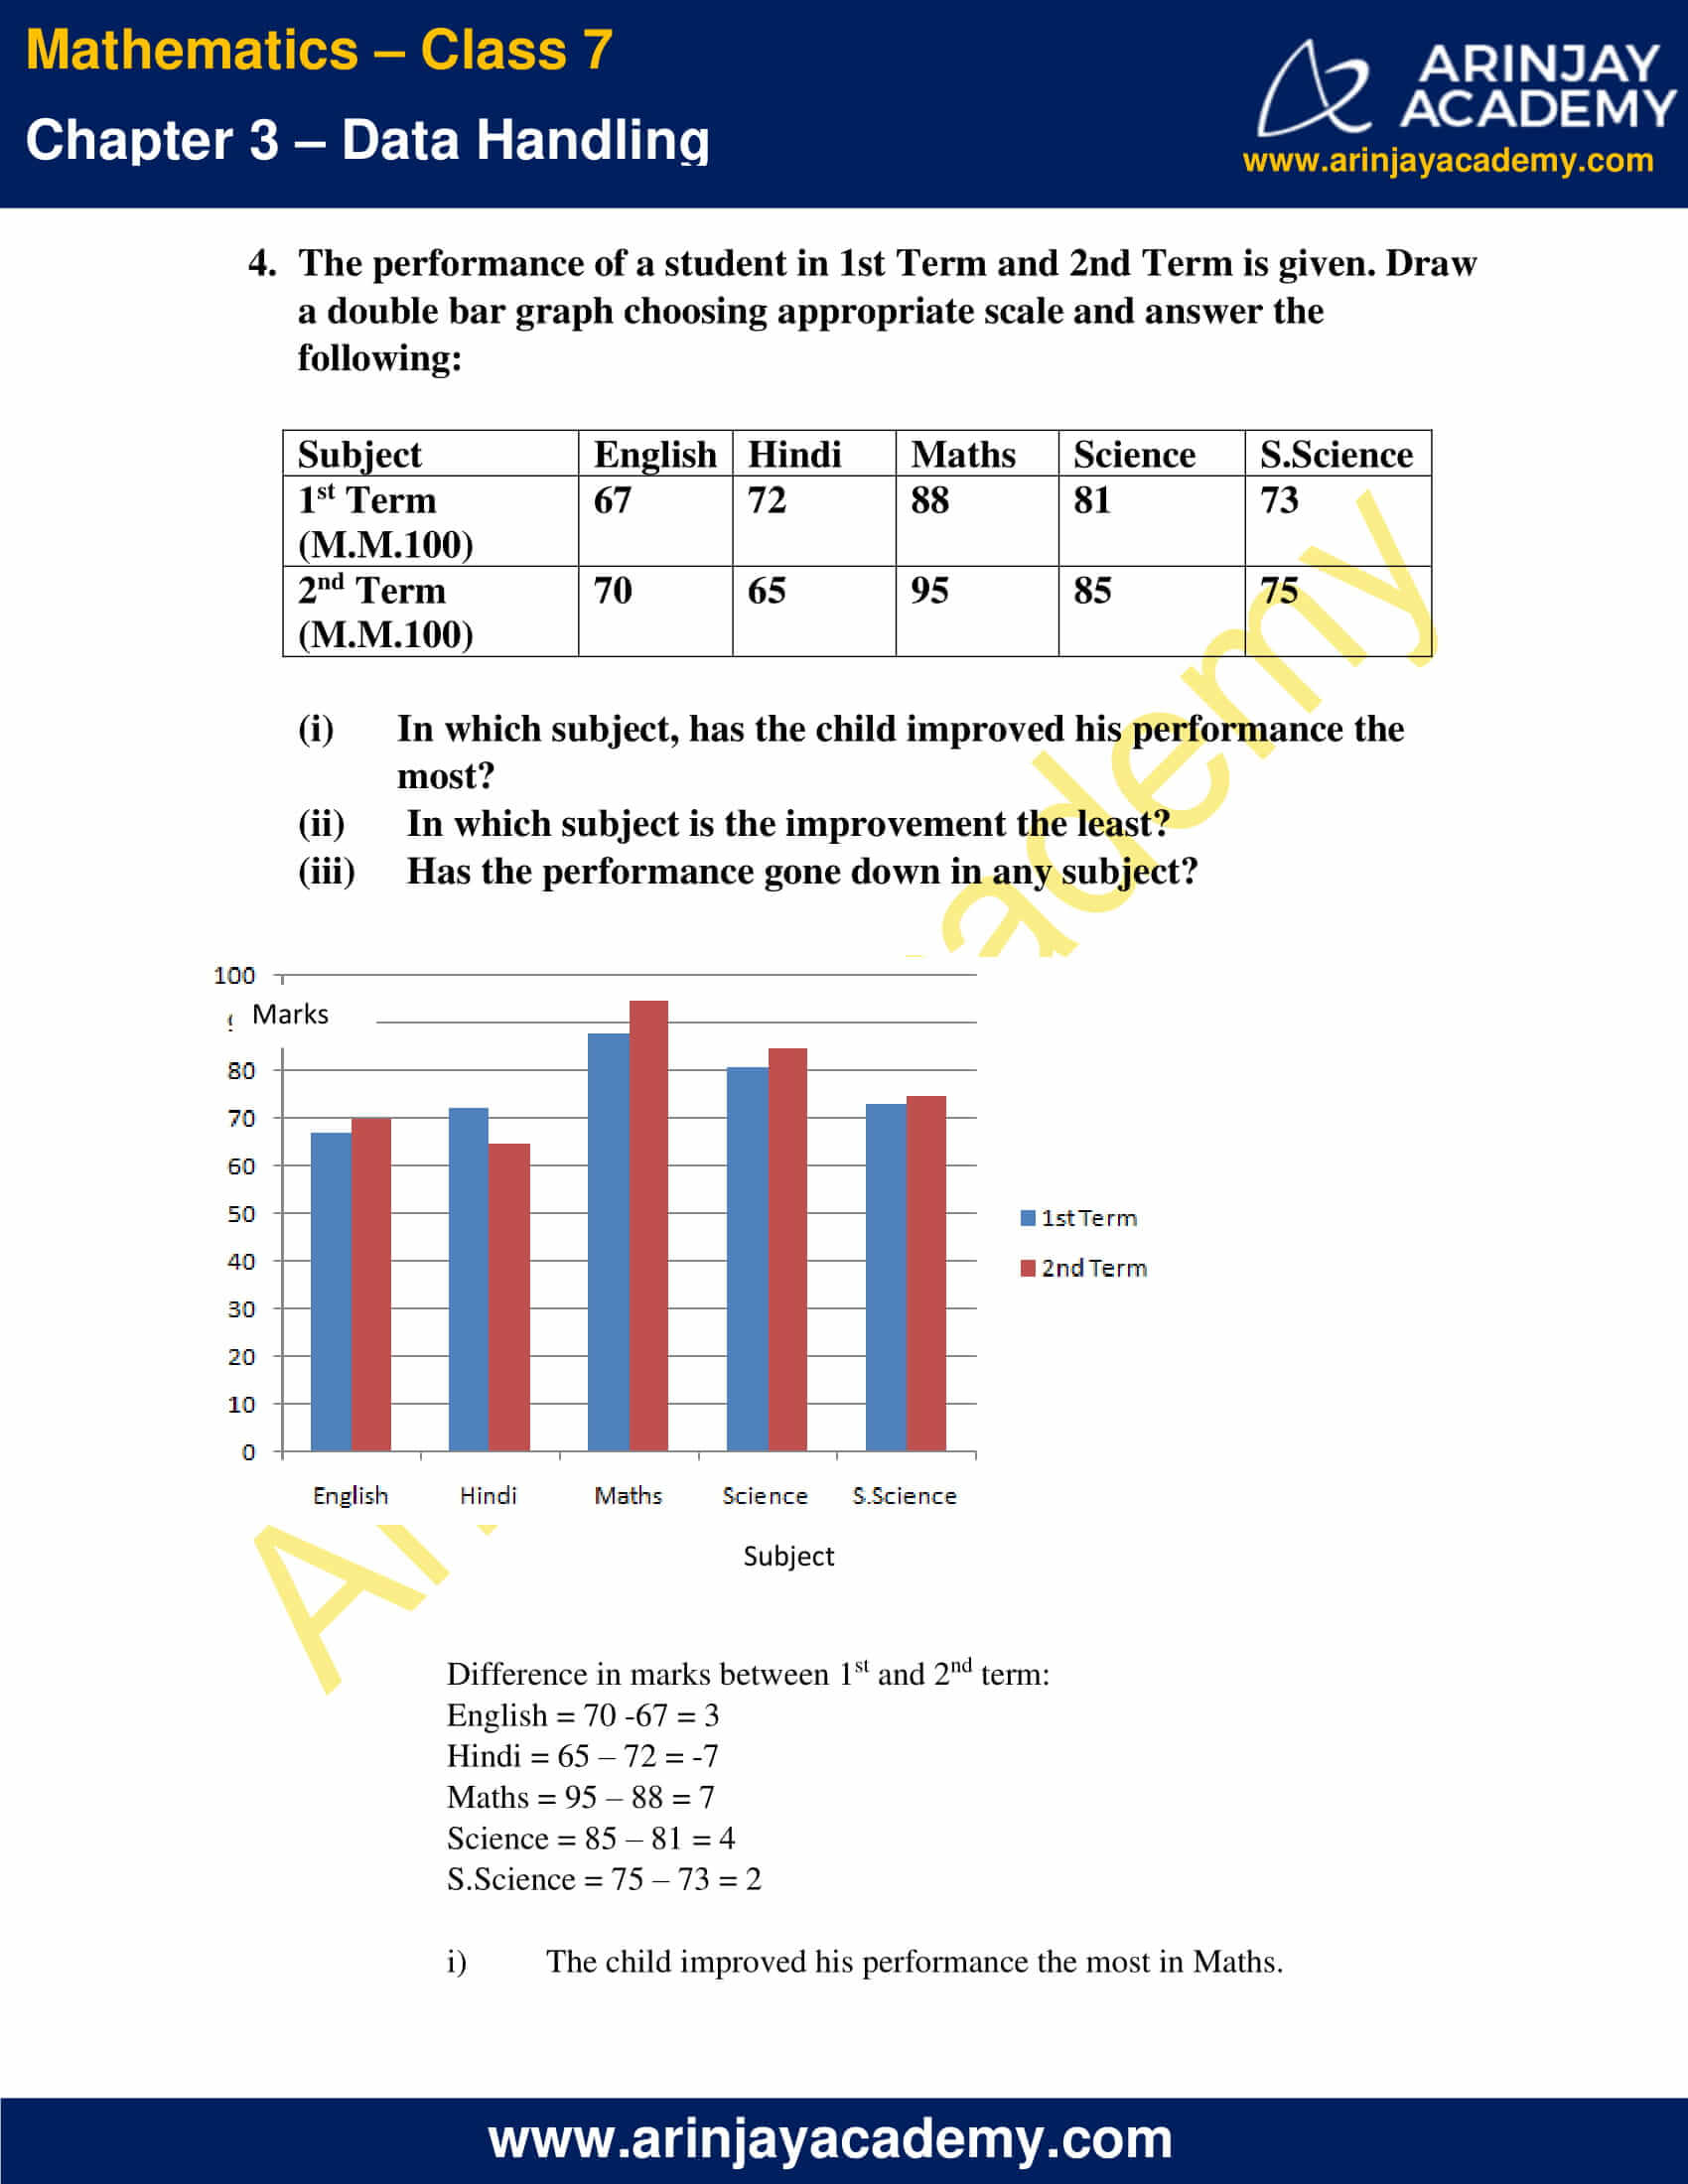
4. The performance of a student in 1st Term and 2nd Term is given. Draw a double bar graph choosing appropriate scale and answer the following:
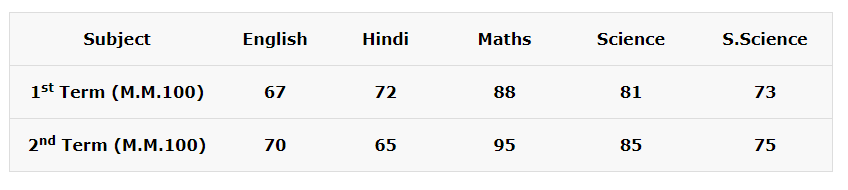
(i) In which subject, has the child improved his performance the most?
(ii) In which subject is the improvement the least?
(iii) Has the performance gone down in any subject?
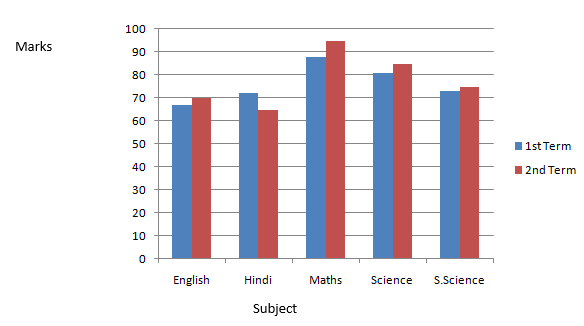
Difference in marks between 1st and 2nd term:
English = 70 -67 = 3
Hindi = 65 – 72 = -7
Maths = 95 – 88 = 7
Science = 85 – 81 = 4
S.Science = 75 – 73 = 2
i) The child improved his performance the most in Maths.
ii) The child improved his performance the least in S.Science.
iii) His performance has gone down in Hindi
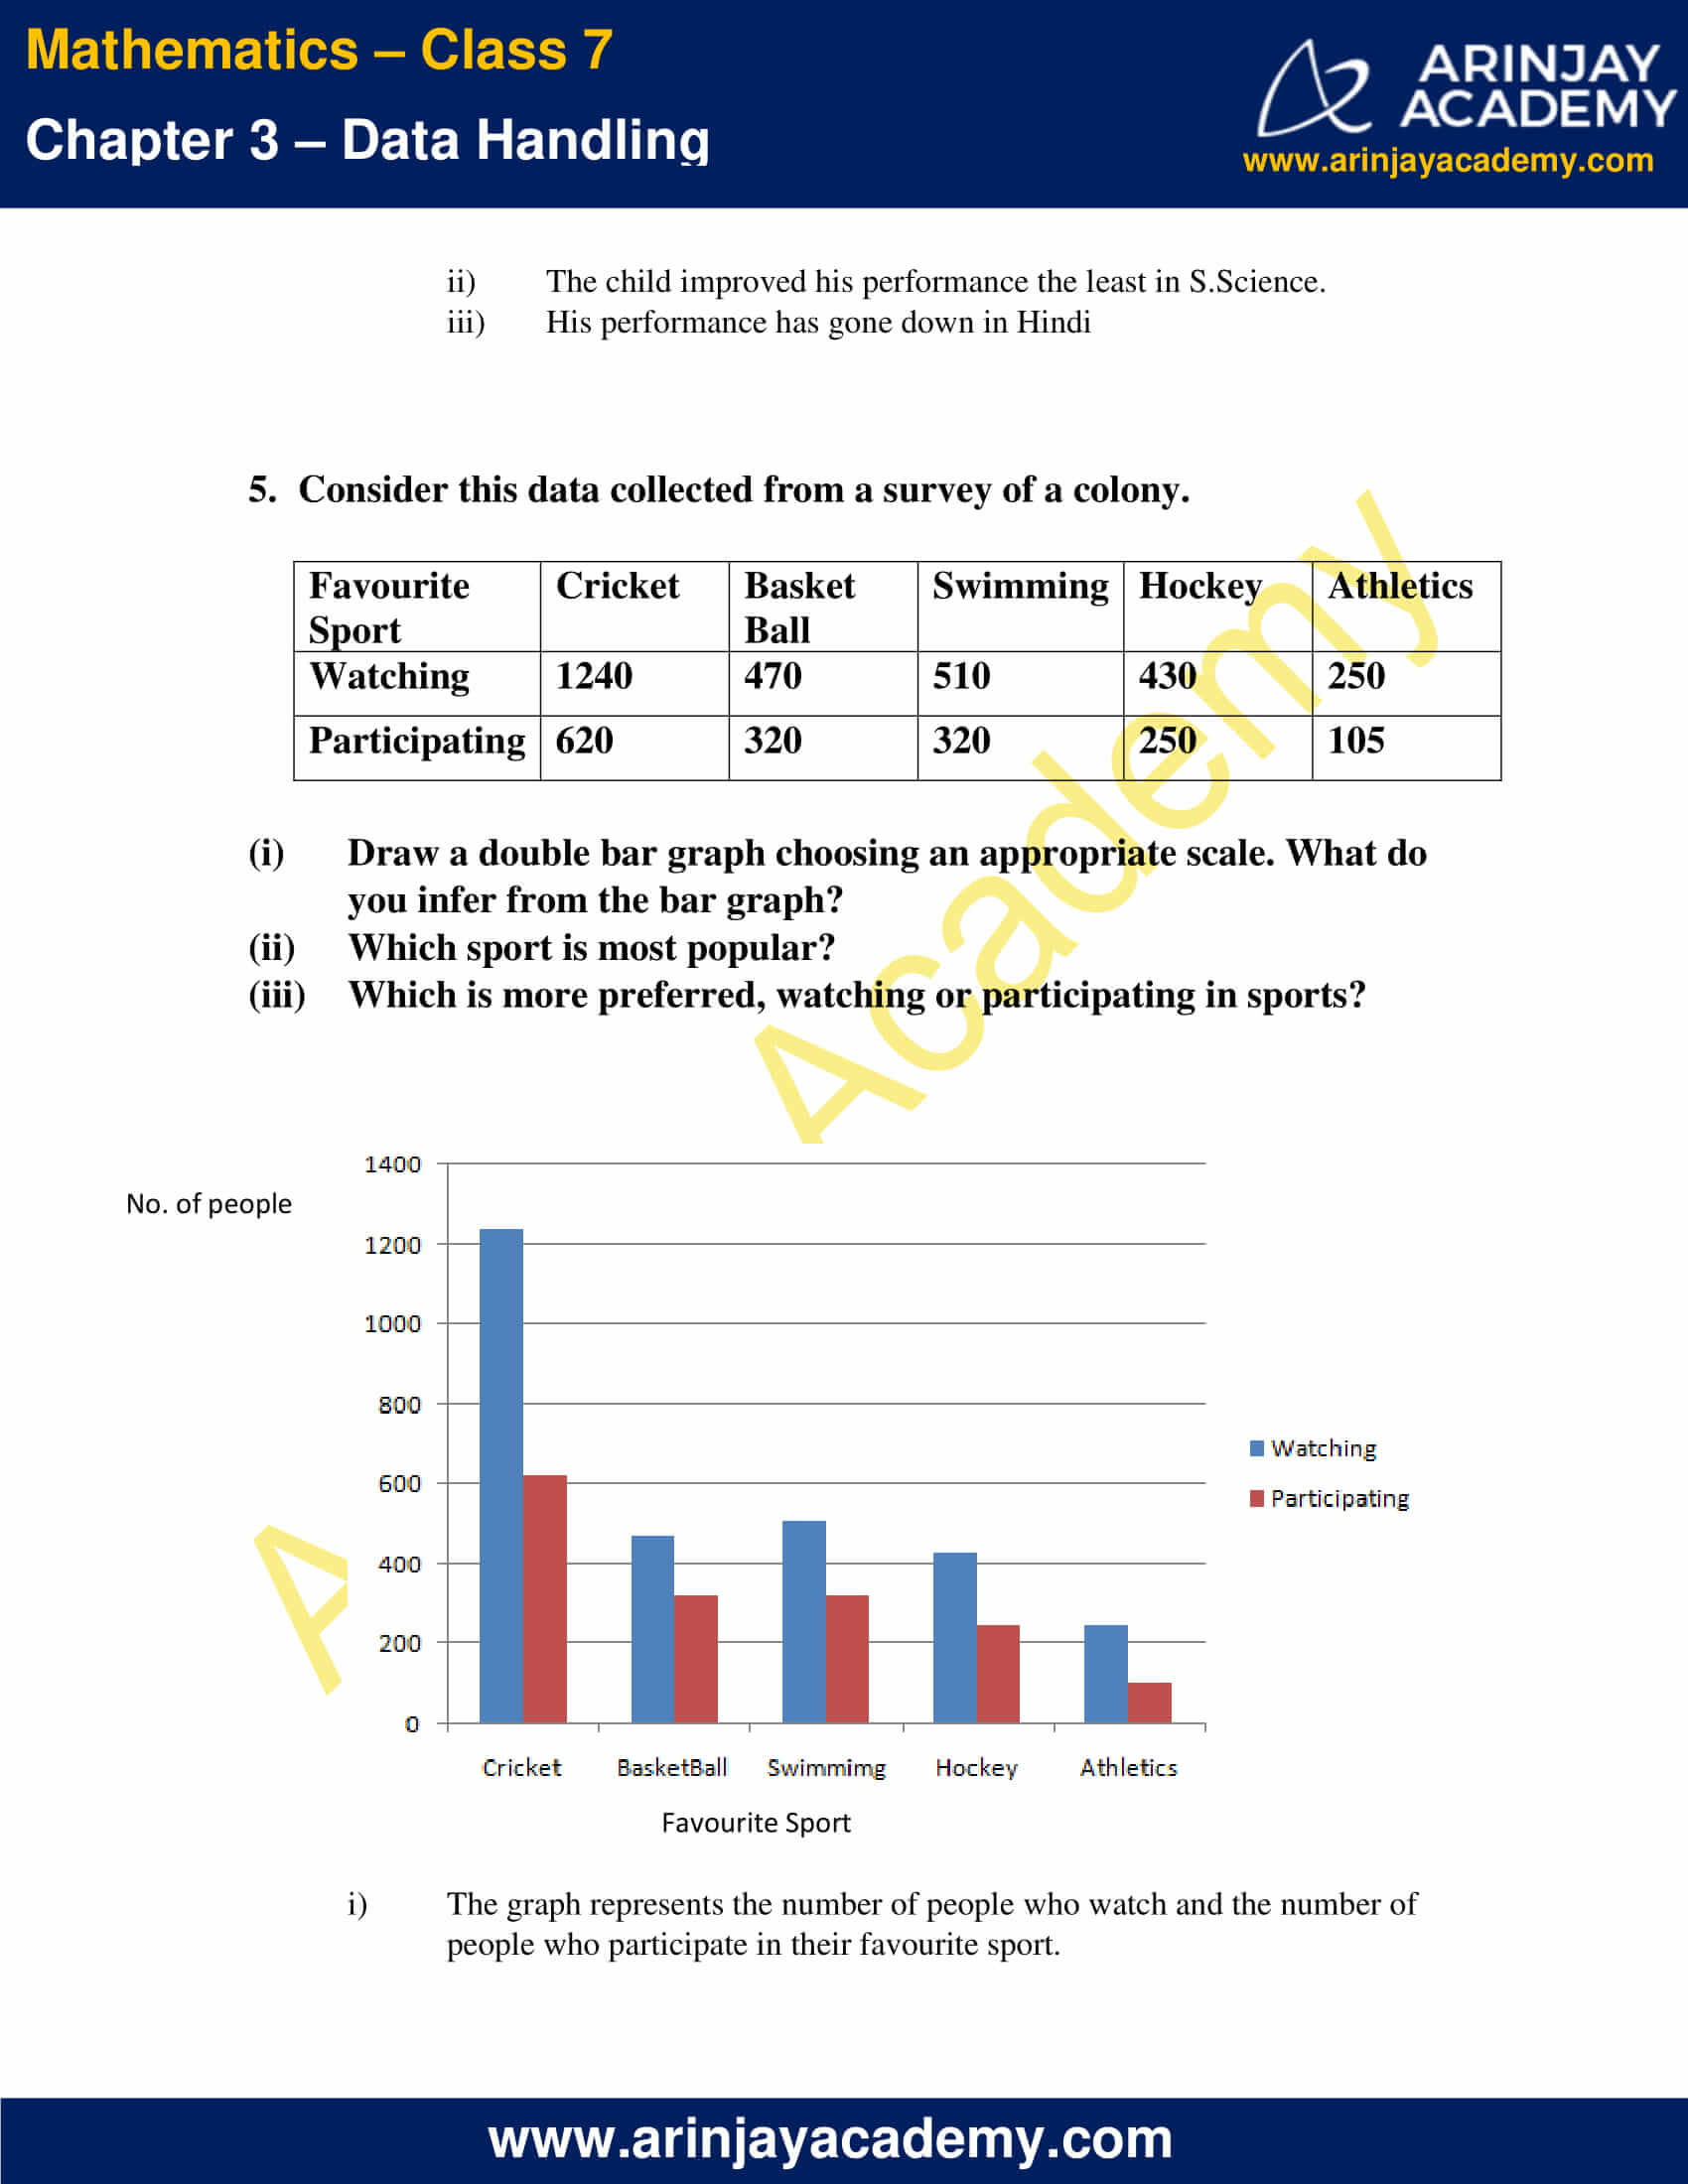
5. Consider this data collected from a survey of a colony.
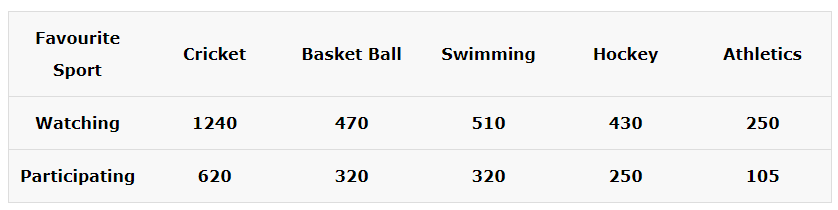
(i) Draw a double bar graph choosing an appropriate scale. What do you infer from the bar graph?
(ii) Which sport is most popular?
(iii) Which is more preferred, watching or participating in sports?
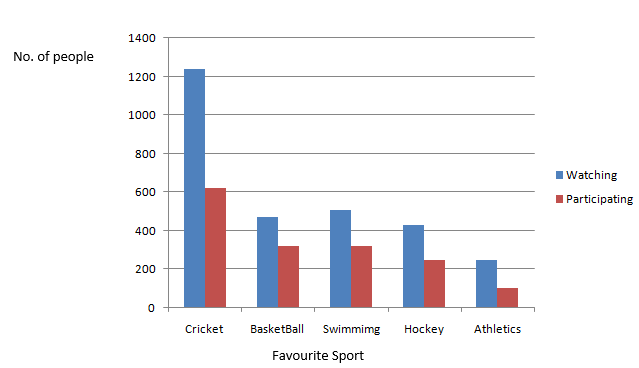
i) The graph represents the number of people who watch and the number of people who participate in their favourite sport.
ii) Cricket is the most popular sport.
iii) Watching sports is more preferred.
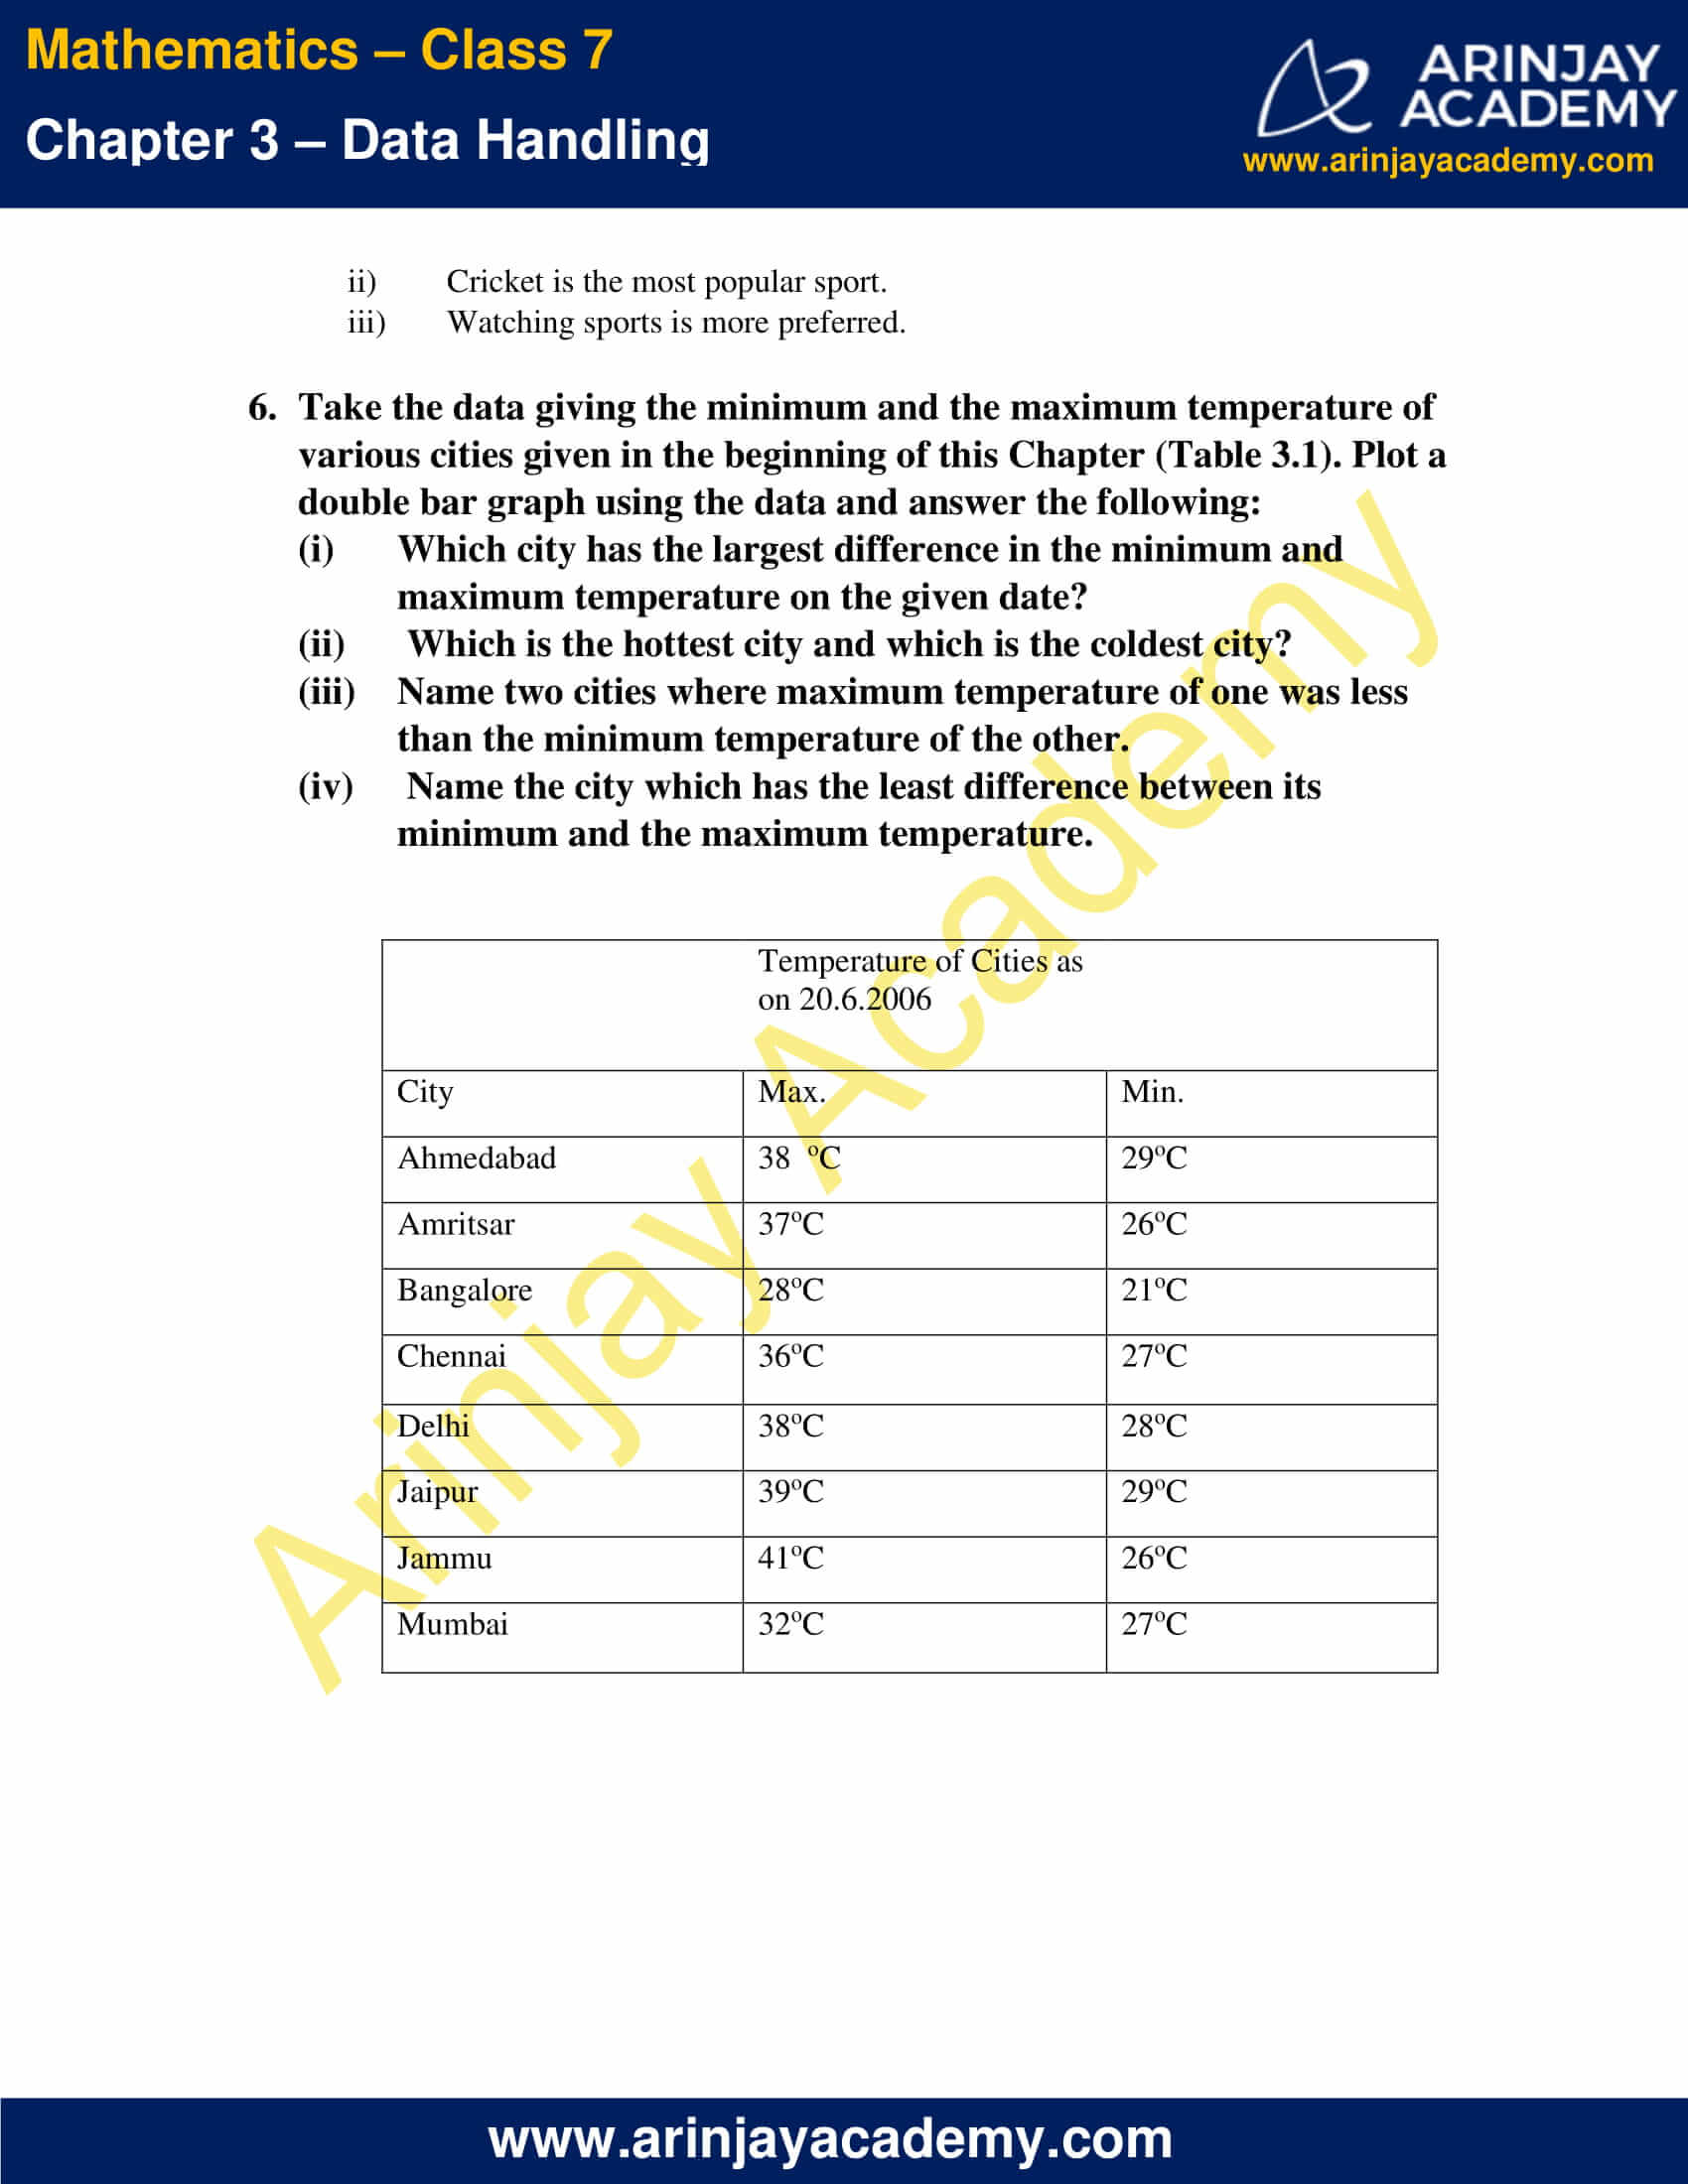
6. Take the data giving the minimum and the maximum temperature of various cities given in the beginning of this Chapter (Table 3.1). Plot a double bar graph using the data and answer the following:
(i) Which city has the largest difference in the minimum and maximum temperature on the given date?
(ii) Which is the hottest city and which is the coldest city?
(iii) Name two cities where maximum temperature of one was less than the minimum temperature of the other.
(iv) Name the city which has the least difference between its minimum and the maximum temperature.
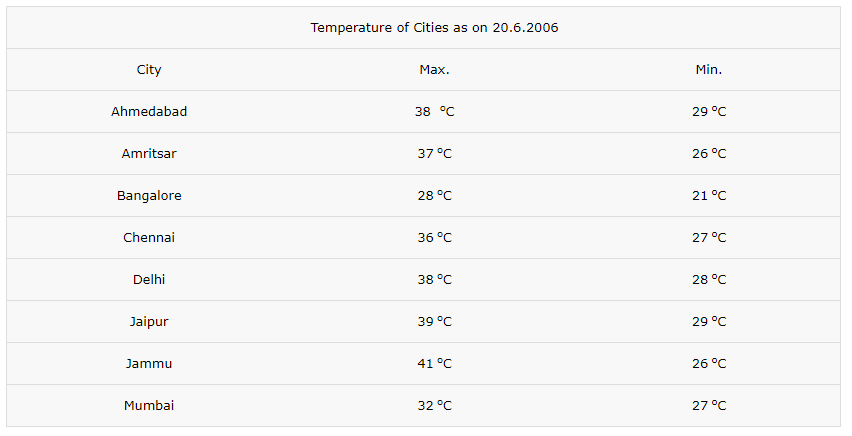
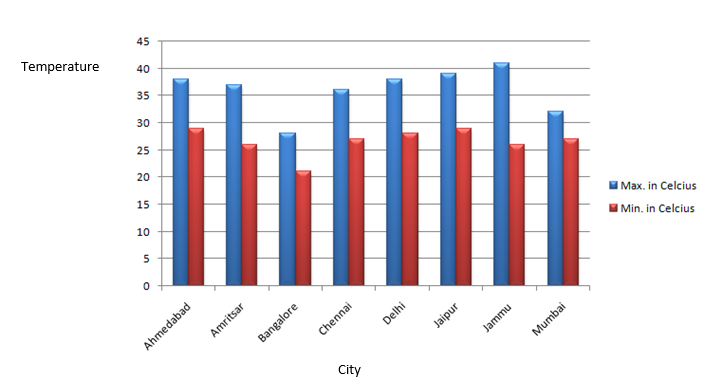
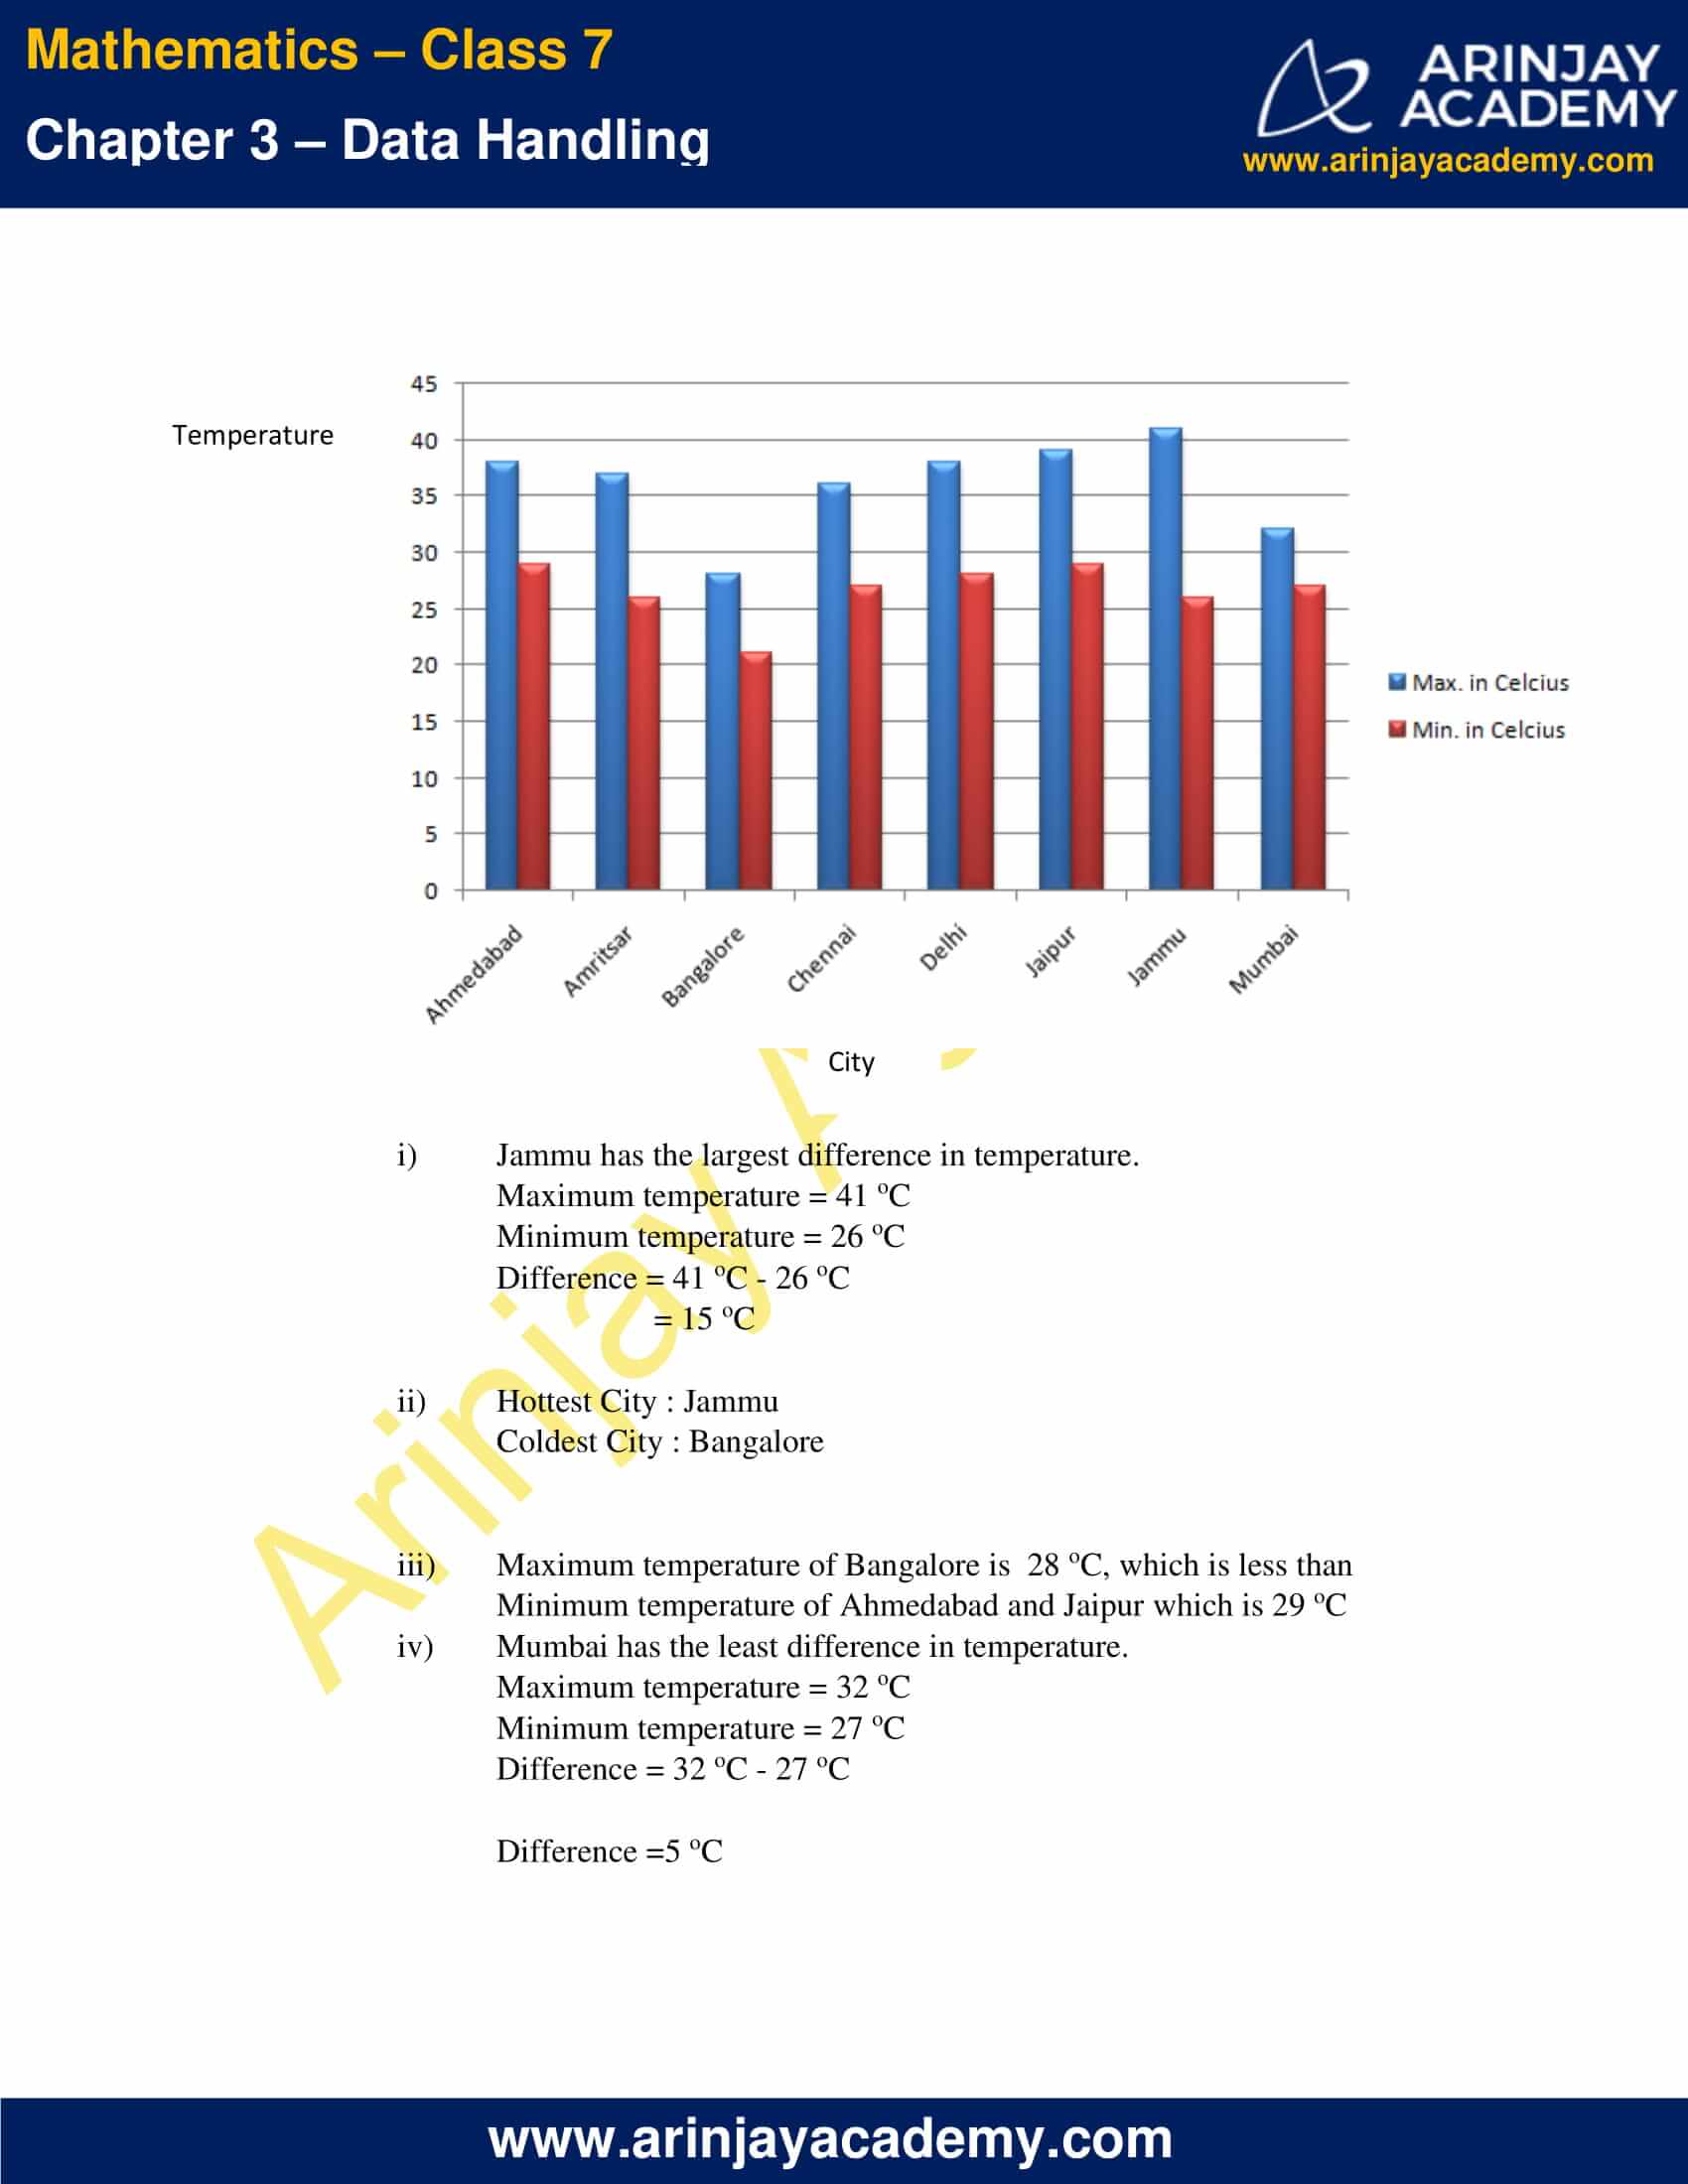
(i) Jammu has the largest difference in temperature.
Maximum temperature = 41 oC
Minimum temperature = 26 oC
Difference = 41 oC – 26 oC
= 15 oC
(ii) Hottest City : Jammu
Coldest City : Bangalore
(iii) Maximum temperature of Bangalore is 28 oC, which is less than
Minimum temperature of Ahmedabad and Jaipur which is 29 oC
(iv) Mumbai has the least difference in temperature.
Maximum temperature = 32 oC
Minimum temperature = 27 oC
Difference = 32 oC – 27 oC
Difference =5 oC
NCERT Solutions for Class 7 Maths Chapter 3 Exercise 3.4 – Data Handling
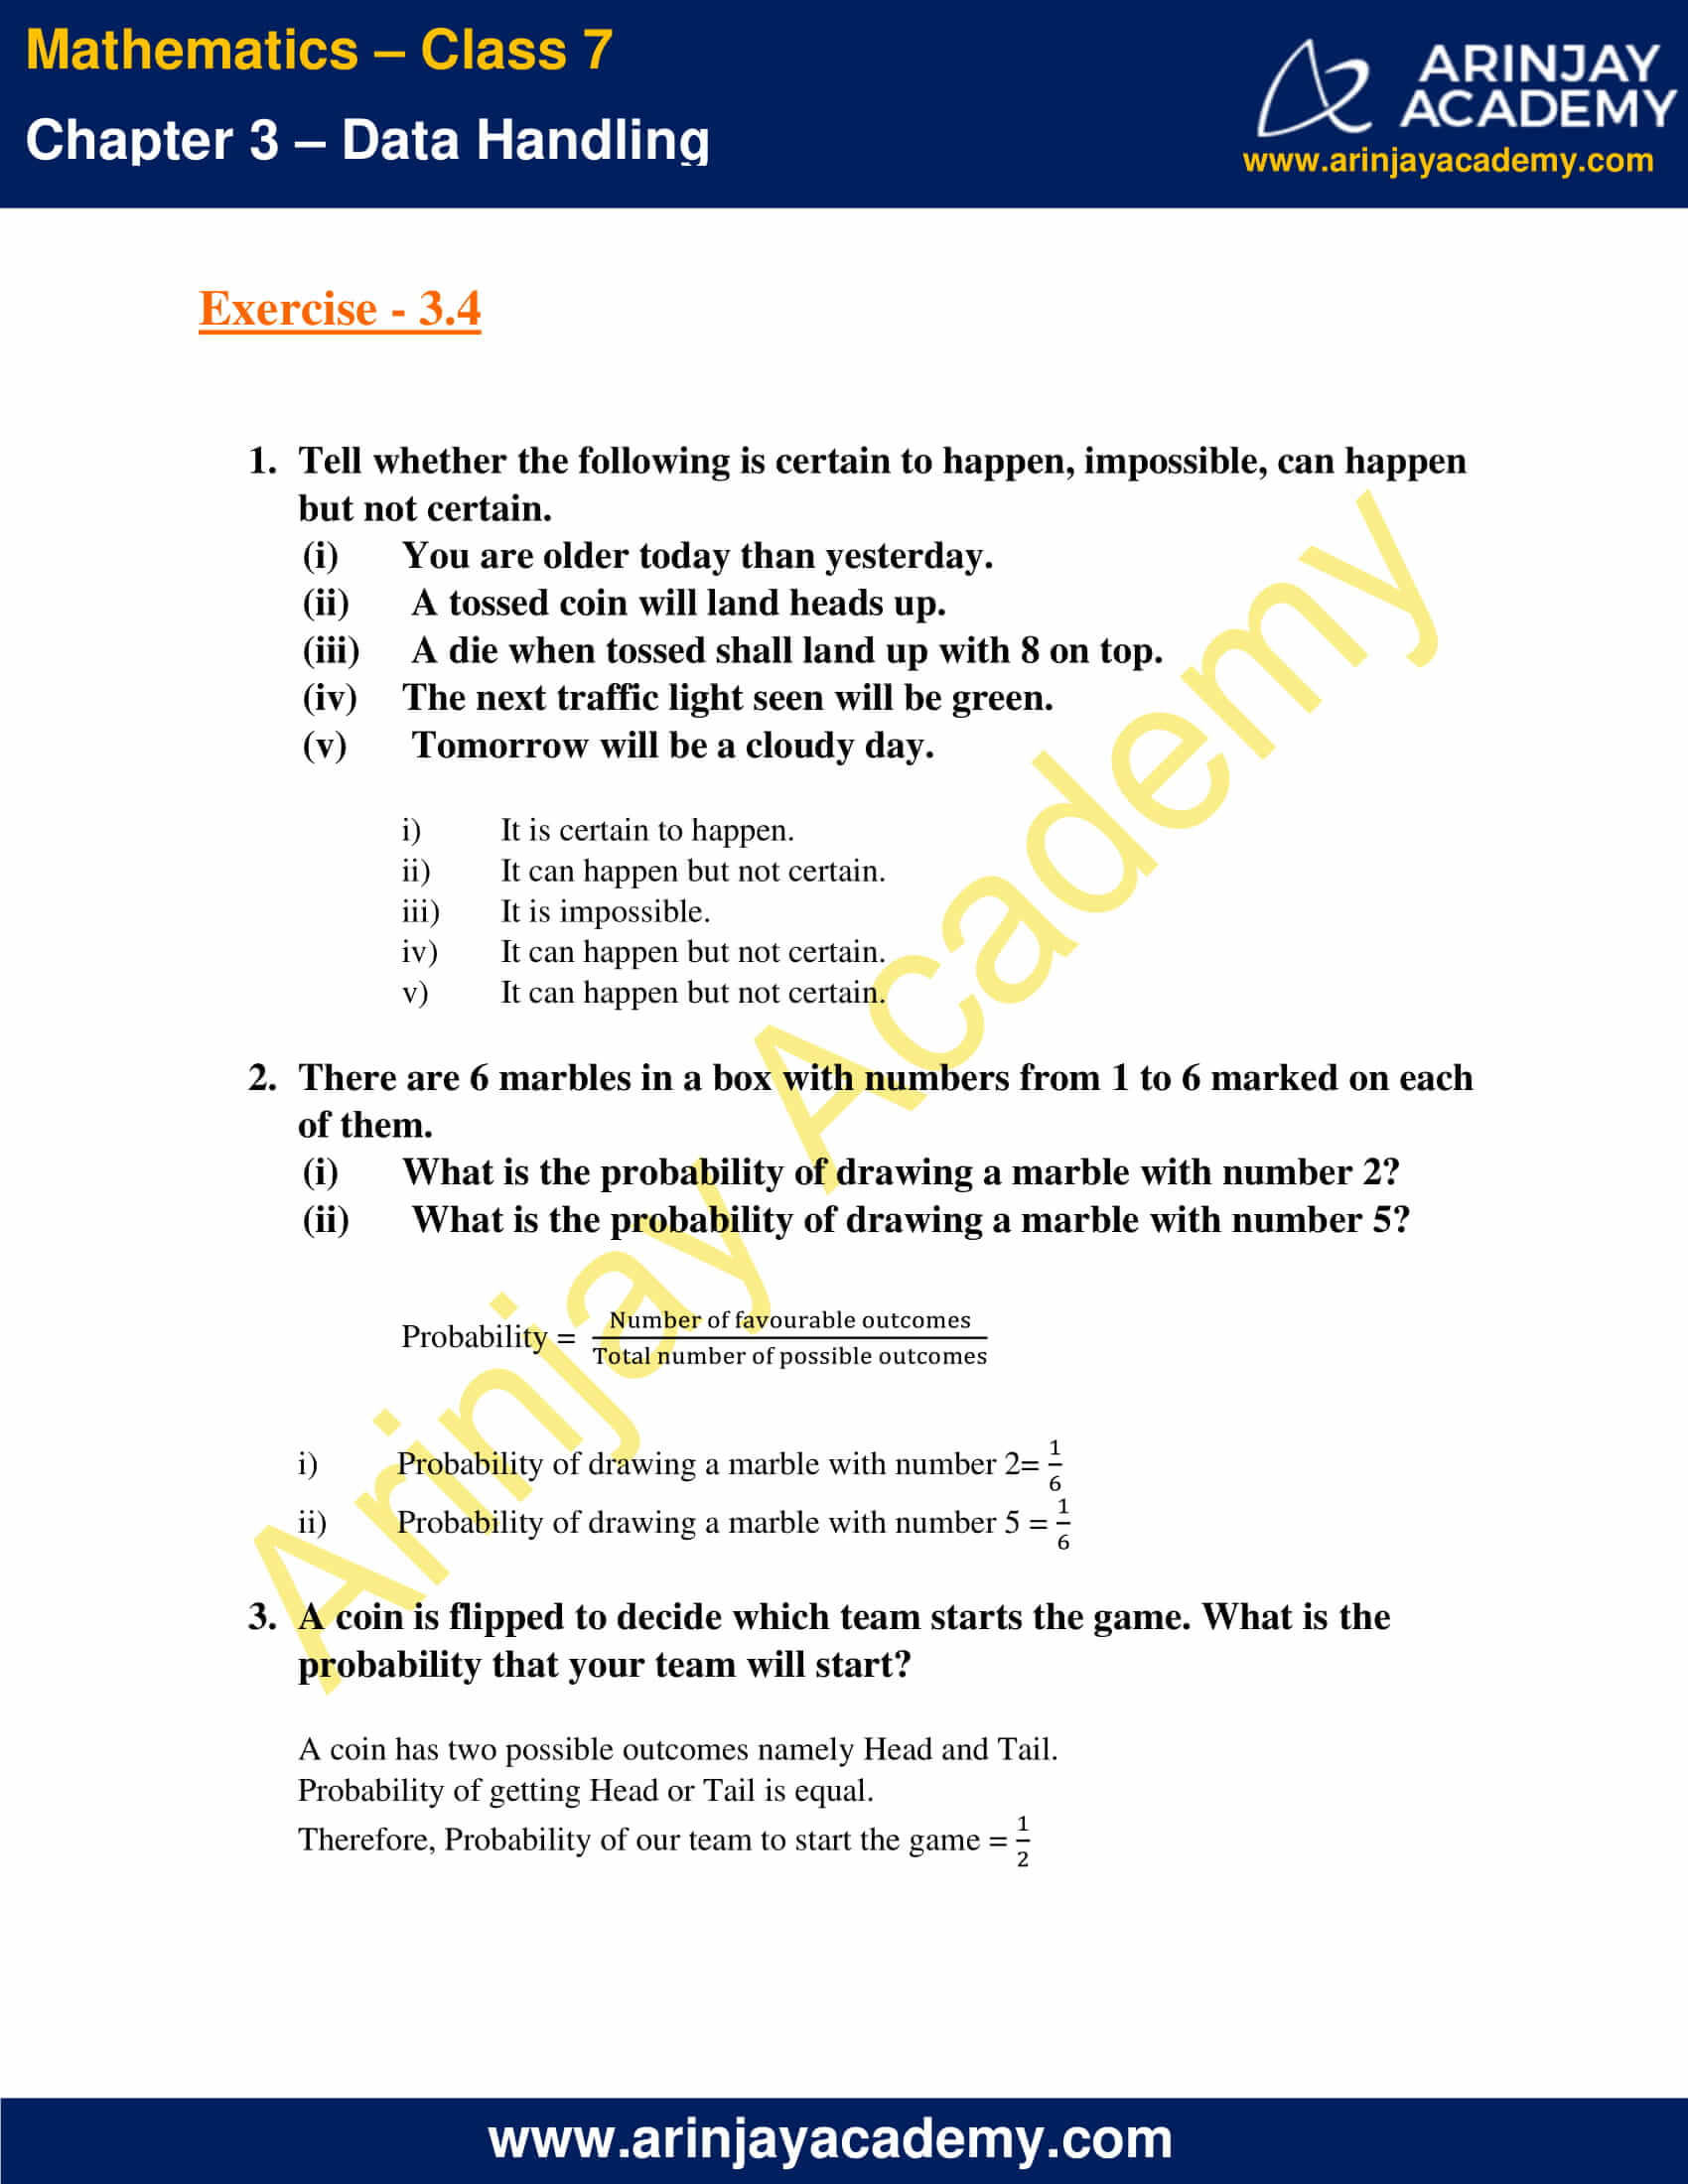
1. Tell whether the following is certain to happen, impossible, can happen but not certain.
(i) You are older today than yesterday.
(ii) A tossed coin will land heads up.
(iii) A die when tossed shall land up with 8 on top.
(iv) The next traffic light seen will be green.
(v) Tomorrow will be a cloudy day.
Solution:
(i) It is certain to happen.
(ii) It can happen but not certain.
(iii) It is impossible.
(iv) It can happen but not certain.
(v) It can happen but not certain.
2. There are 6 marbles in a box with numbers from 1 to 6 marked on each of them.
(i) What is the probability of drawing a marble with number 2?
(ii) What is the probability of drawing a marble with number 5?
Probability = Number of favourable outcomes/Total number of possible outcomes
(i) Probability of drawing a marble with number 2= 1/6
(ii) Probability of drawing a marble with number 5 = 1/6
3. A coin is flipped to decide which team starts the game. What is the probability that your team will start?
A coin has two possible outcomes namely Head and Tail.
Probability of getting Head or Tail is equal.
Therefore Probability of our team to start the game = 1/2
With this we come to the end of NCERT Solutions for Class 7 Maths Chapter 3 Data Handling. We hope these helped you study your subject.
Download NCERT Solutions for Class 7 Maths Chapter 3 – Data Handling