NCERT Solutions for Class 6 Maths Chapter 9 – Data Handling comprises of the 4 Exercises
This Chapter contains the Exercises relating to the following topics, which are discussed in Chapter 9 – Data Handling Class 6 NCERT book : –
- 9.1 Introduction
- 9.2 Recording Data
- 9.3 Organisation of Data
- 9.4 Pictograph
- 9.5 Interpretation of a Pictograph
- 9.6 Drawing a Pictograph
- 9.7 A Bar Graph
- 9.7.1 Interpretation of a bar graph
- 9.7.2 Drawing a bar graph
NCERT Solutions for Class 6 Maths Chapter 9 Exercise 9.1
NCERT Solutions for Class 6 Maths Chapter 9 Exercise 9.2
NCERT Solutions for Class 6 Maths Chapter 9 Exercise 9.3
NCERT Solutions for Class 6 Maths Chapter 9 Exercise 9.4
NCERT Solutions for Class 6 Maths Chapter 9 Exercise 9.1
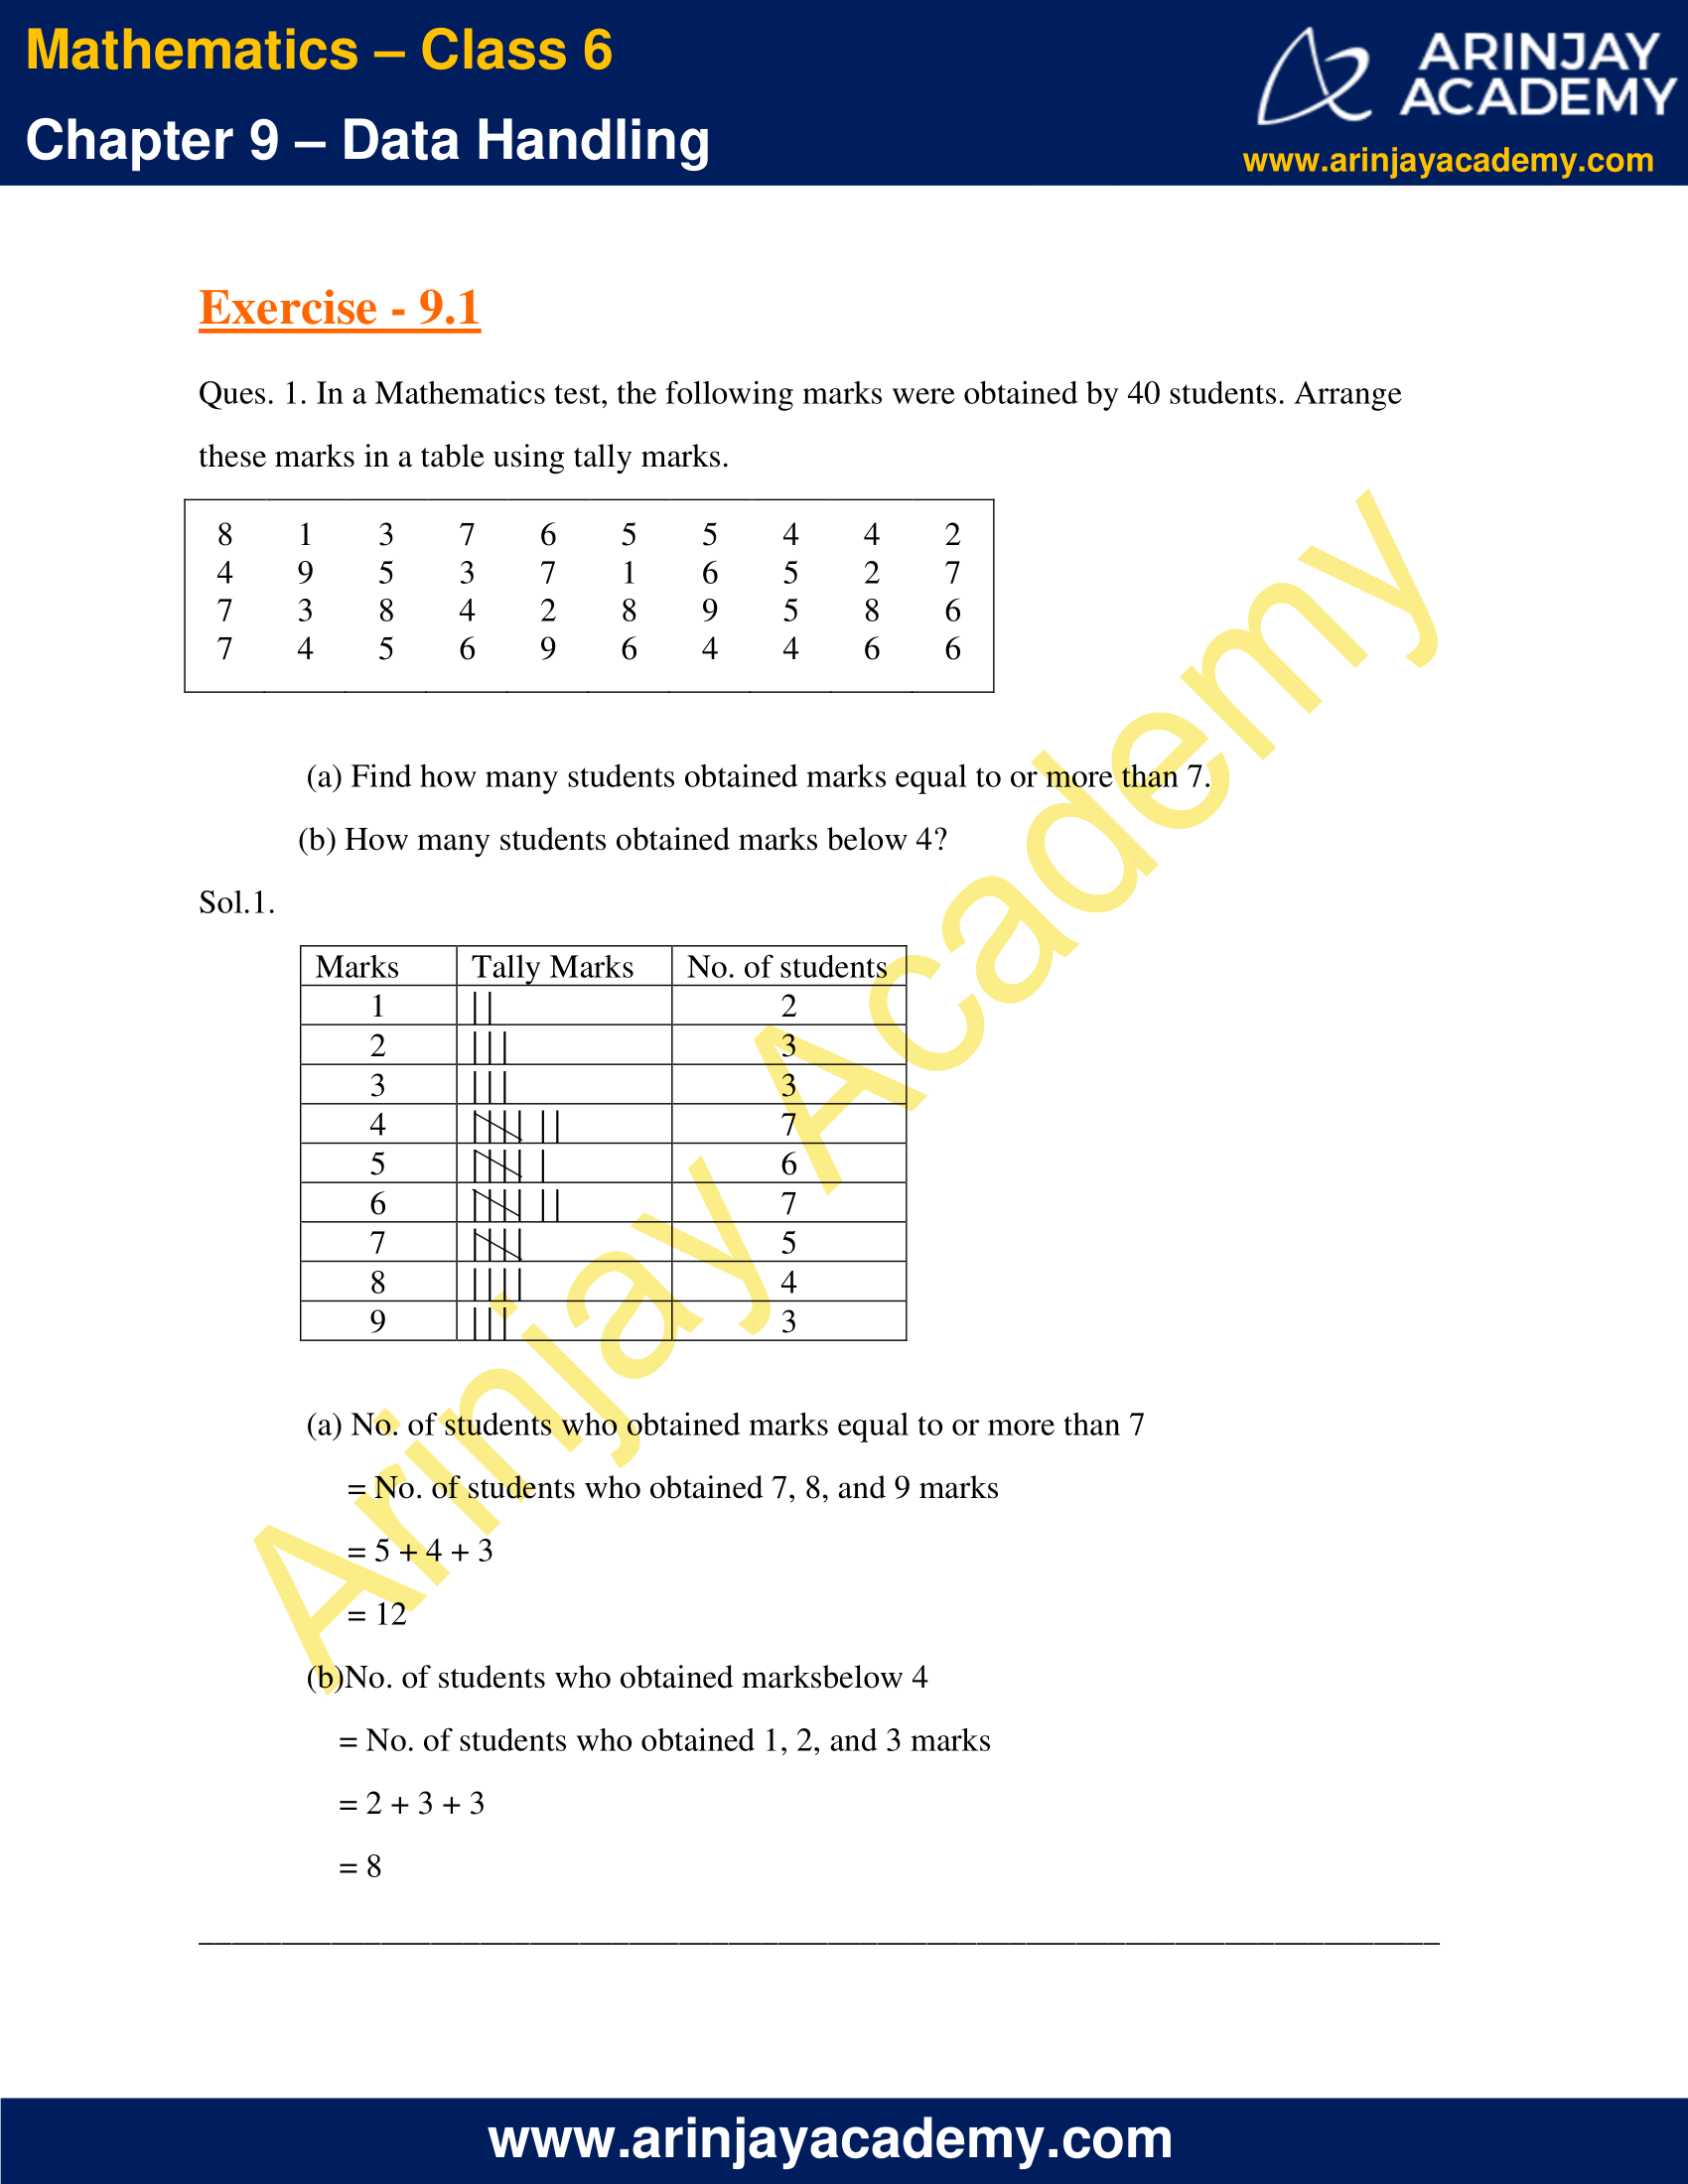
Ques. 1. In a Mathematics test, the following marks were obtained by 40 students. Arrange these marks in a table using tally marks.
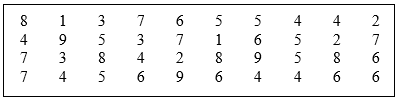
(a) Find how many students obtained marks equal to or more than 7.
(b) How many students obtained marks below 4?
Sol.1.
(a) No. of students who obtained marks equal to or more than 7
= No. of students who obtained 7, 8, and 9 marks
= 5 + 4 + 3
= 12
(b) No. of students who obtained marks below 4
= No. of students who obtained 1, 2, and 3 marks
= 2 + 3 + 3
= 8
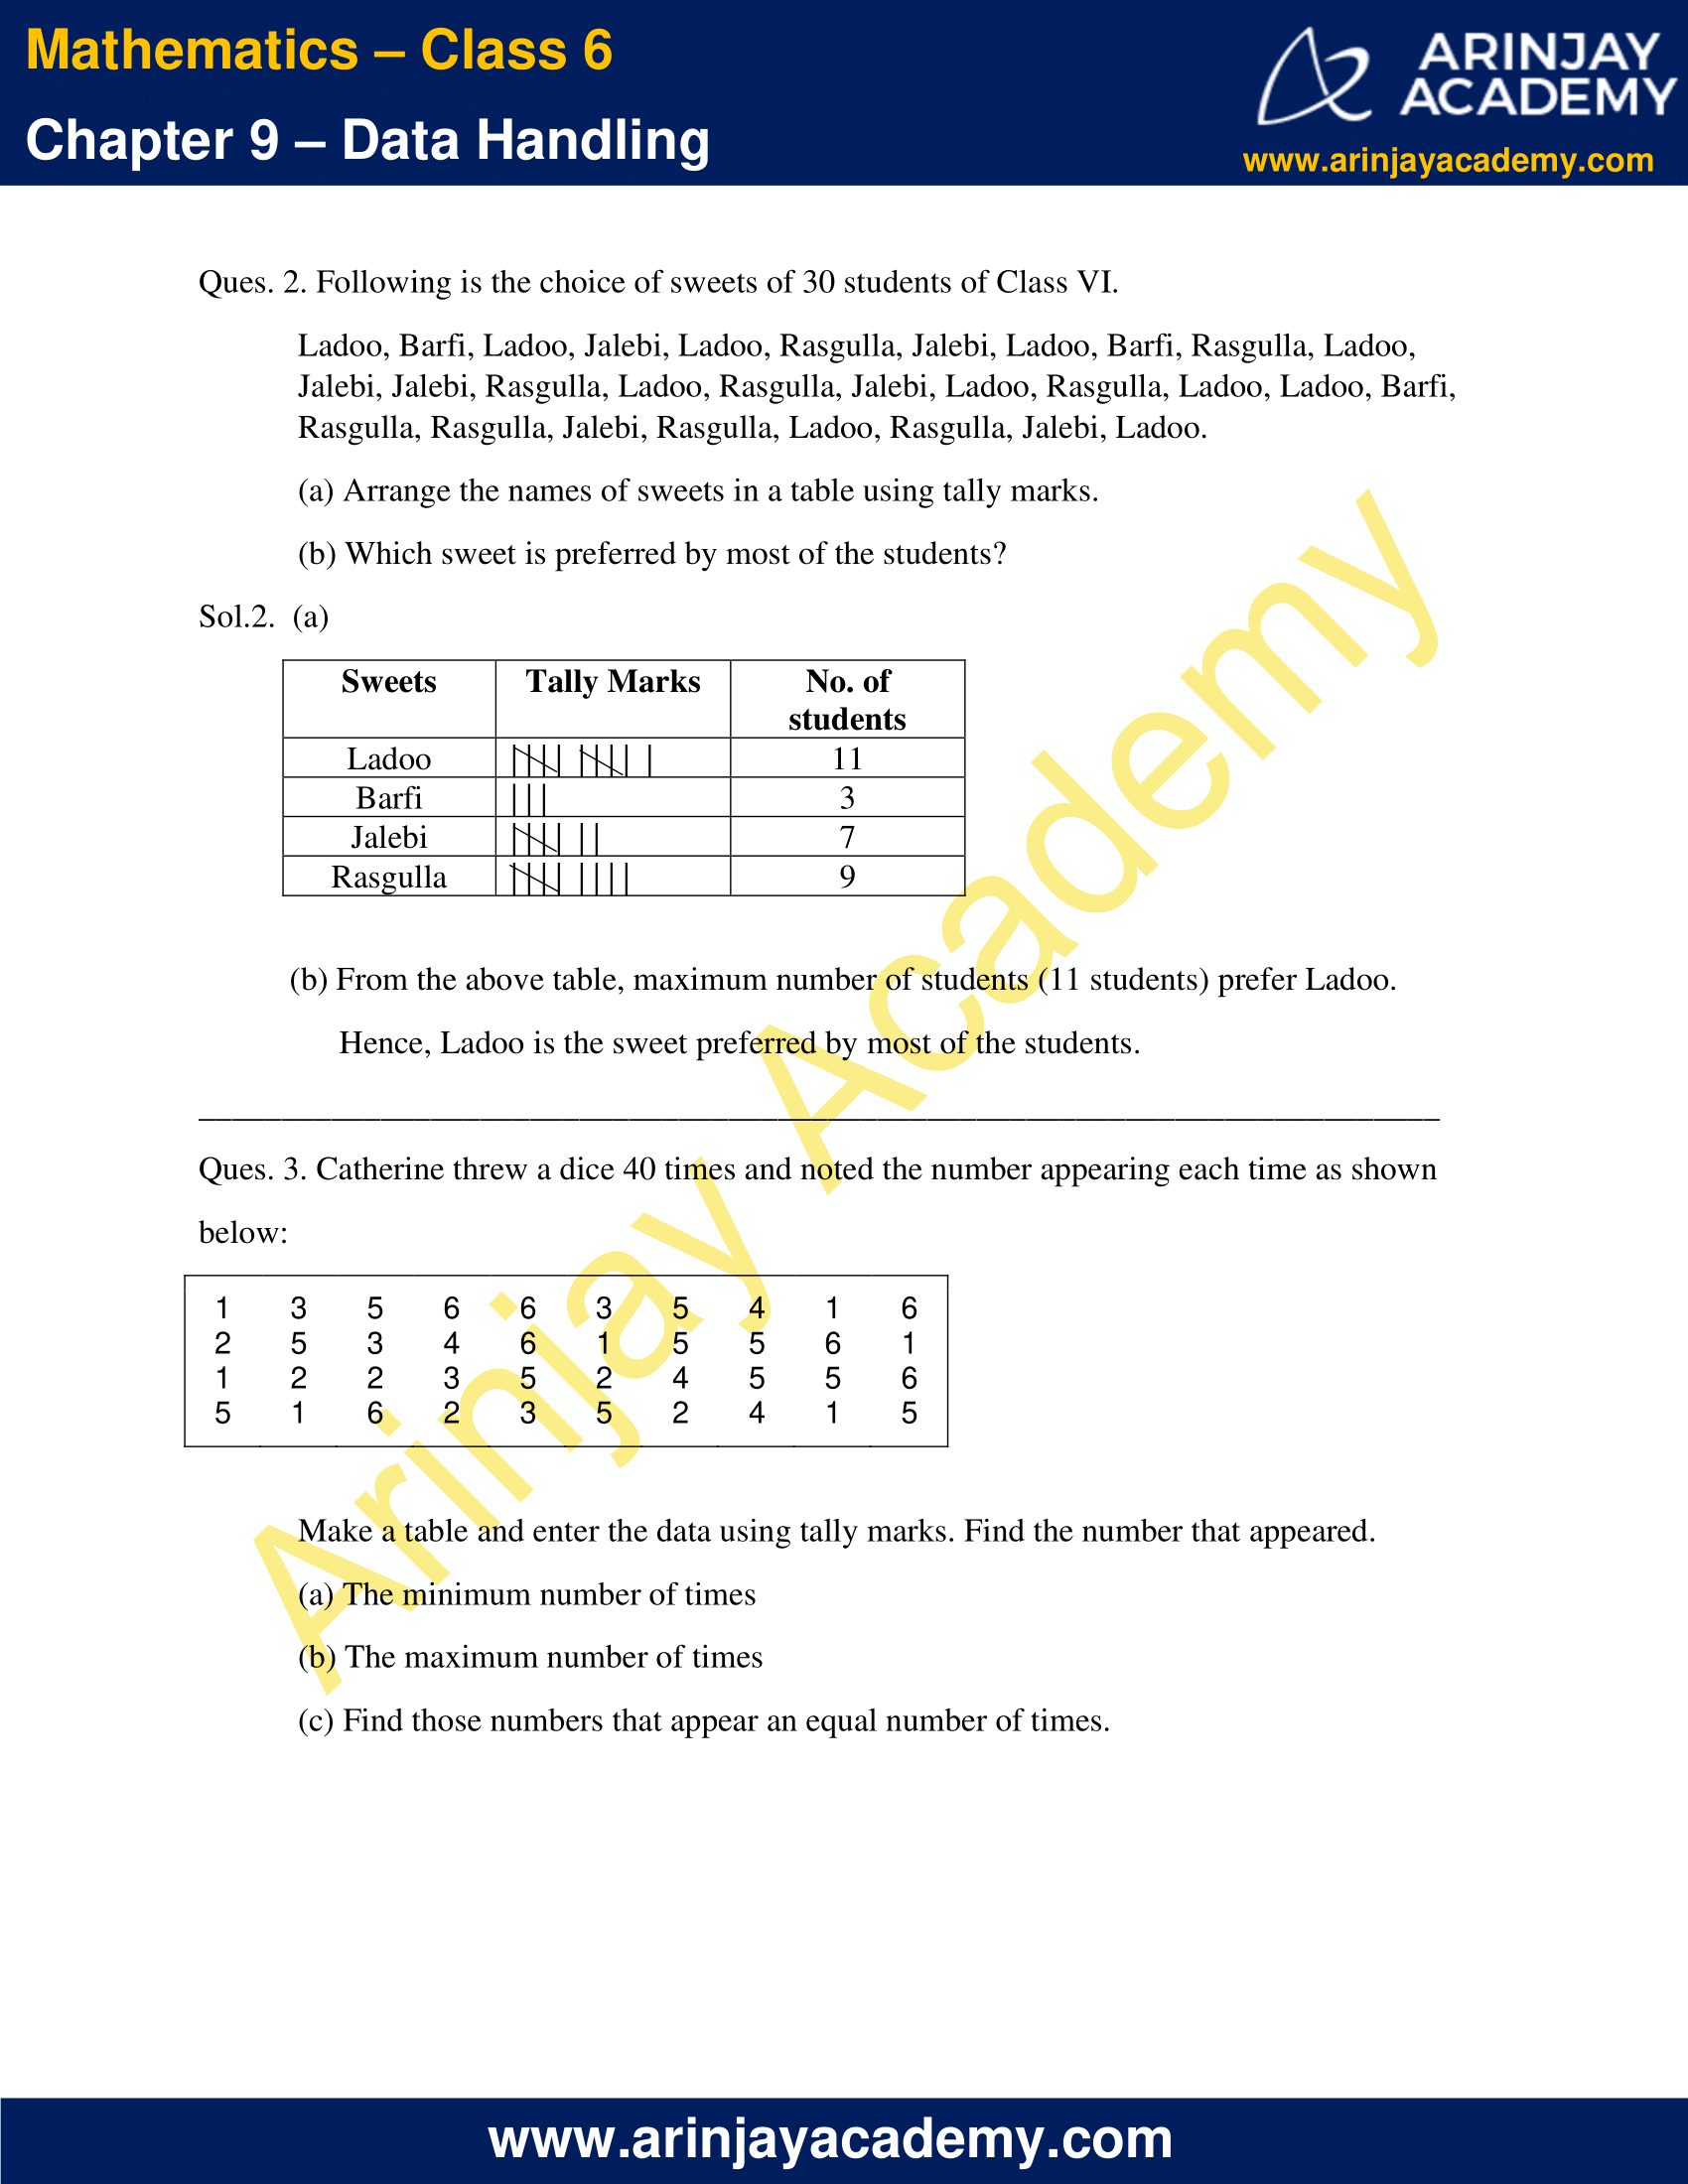
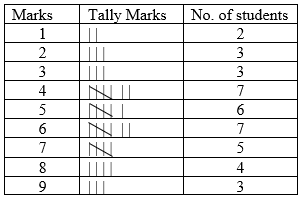
Ques. 2. Following is the choice of sweets of 30 students of Class VI.
Ladoo, Barfi, Ladoo, Jalebi, Ladoo, Rasgulla, Jalebi, Ladoo, Barfi, Rasgulla, Ladoo, Jalebi, Jalebi, Rasgulla, Ladoo, Rasgulla, Jalebi, Ladoo, Rasgulla, Ladoo, Ladoo, Barfi, Rasgulla, Rasgulla, Jalebi, Rasgulla, Ladoo, Rasgulla, Jalebi, Ladoo.
(a) Arrange the names of sweets in a table using tally marks.
(b) Which sweet is preferred by most of the students?
Sol.2. (a)
(b) From the above table, maximum number of students (11 students) prefer Ladoo.
Hence, Ladoo is the sweet preferred by most of the students.
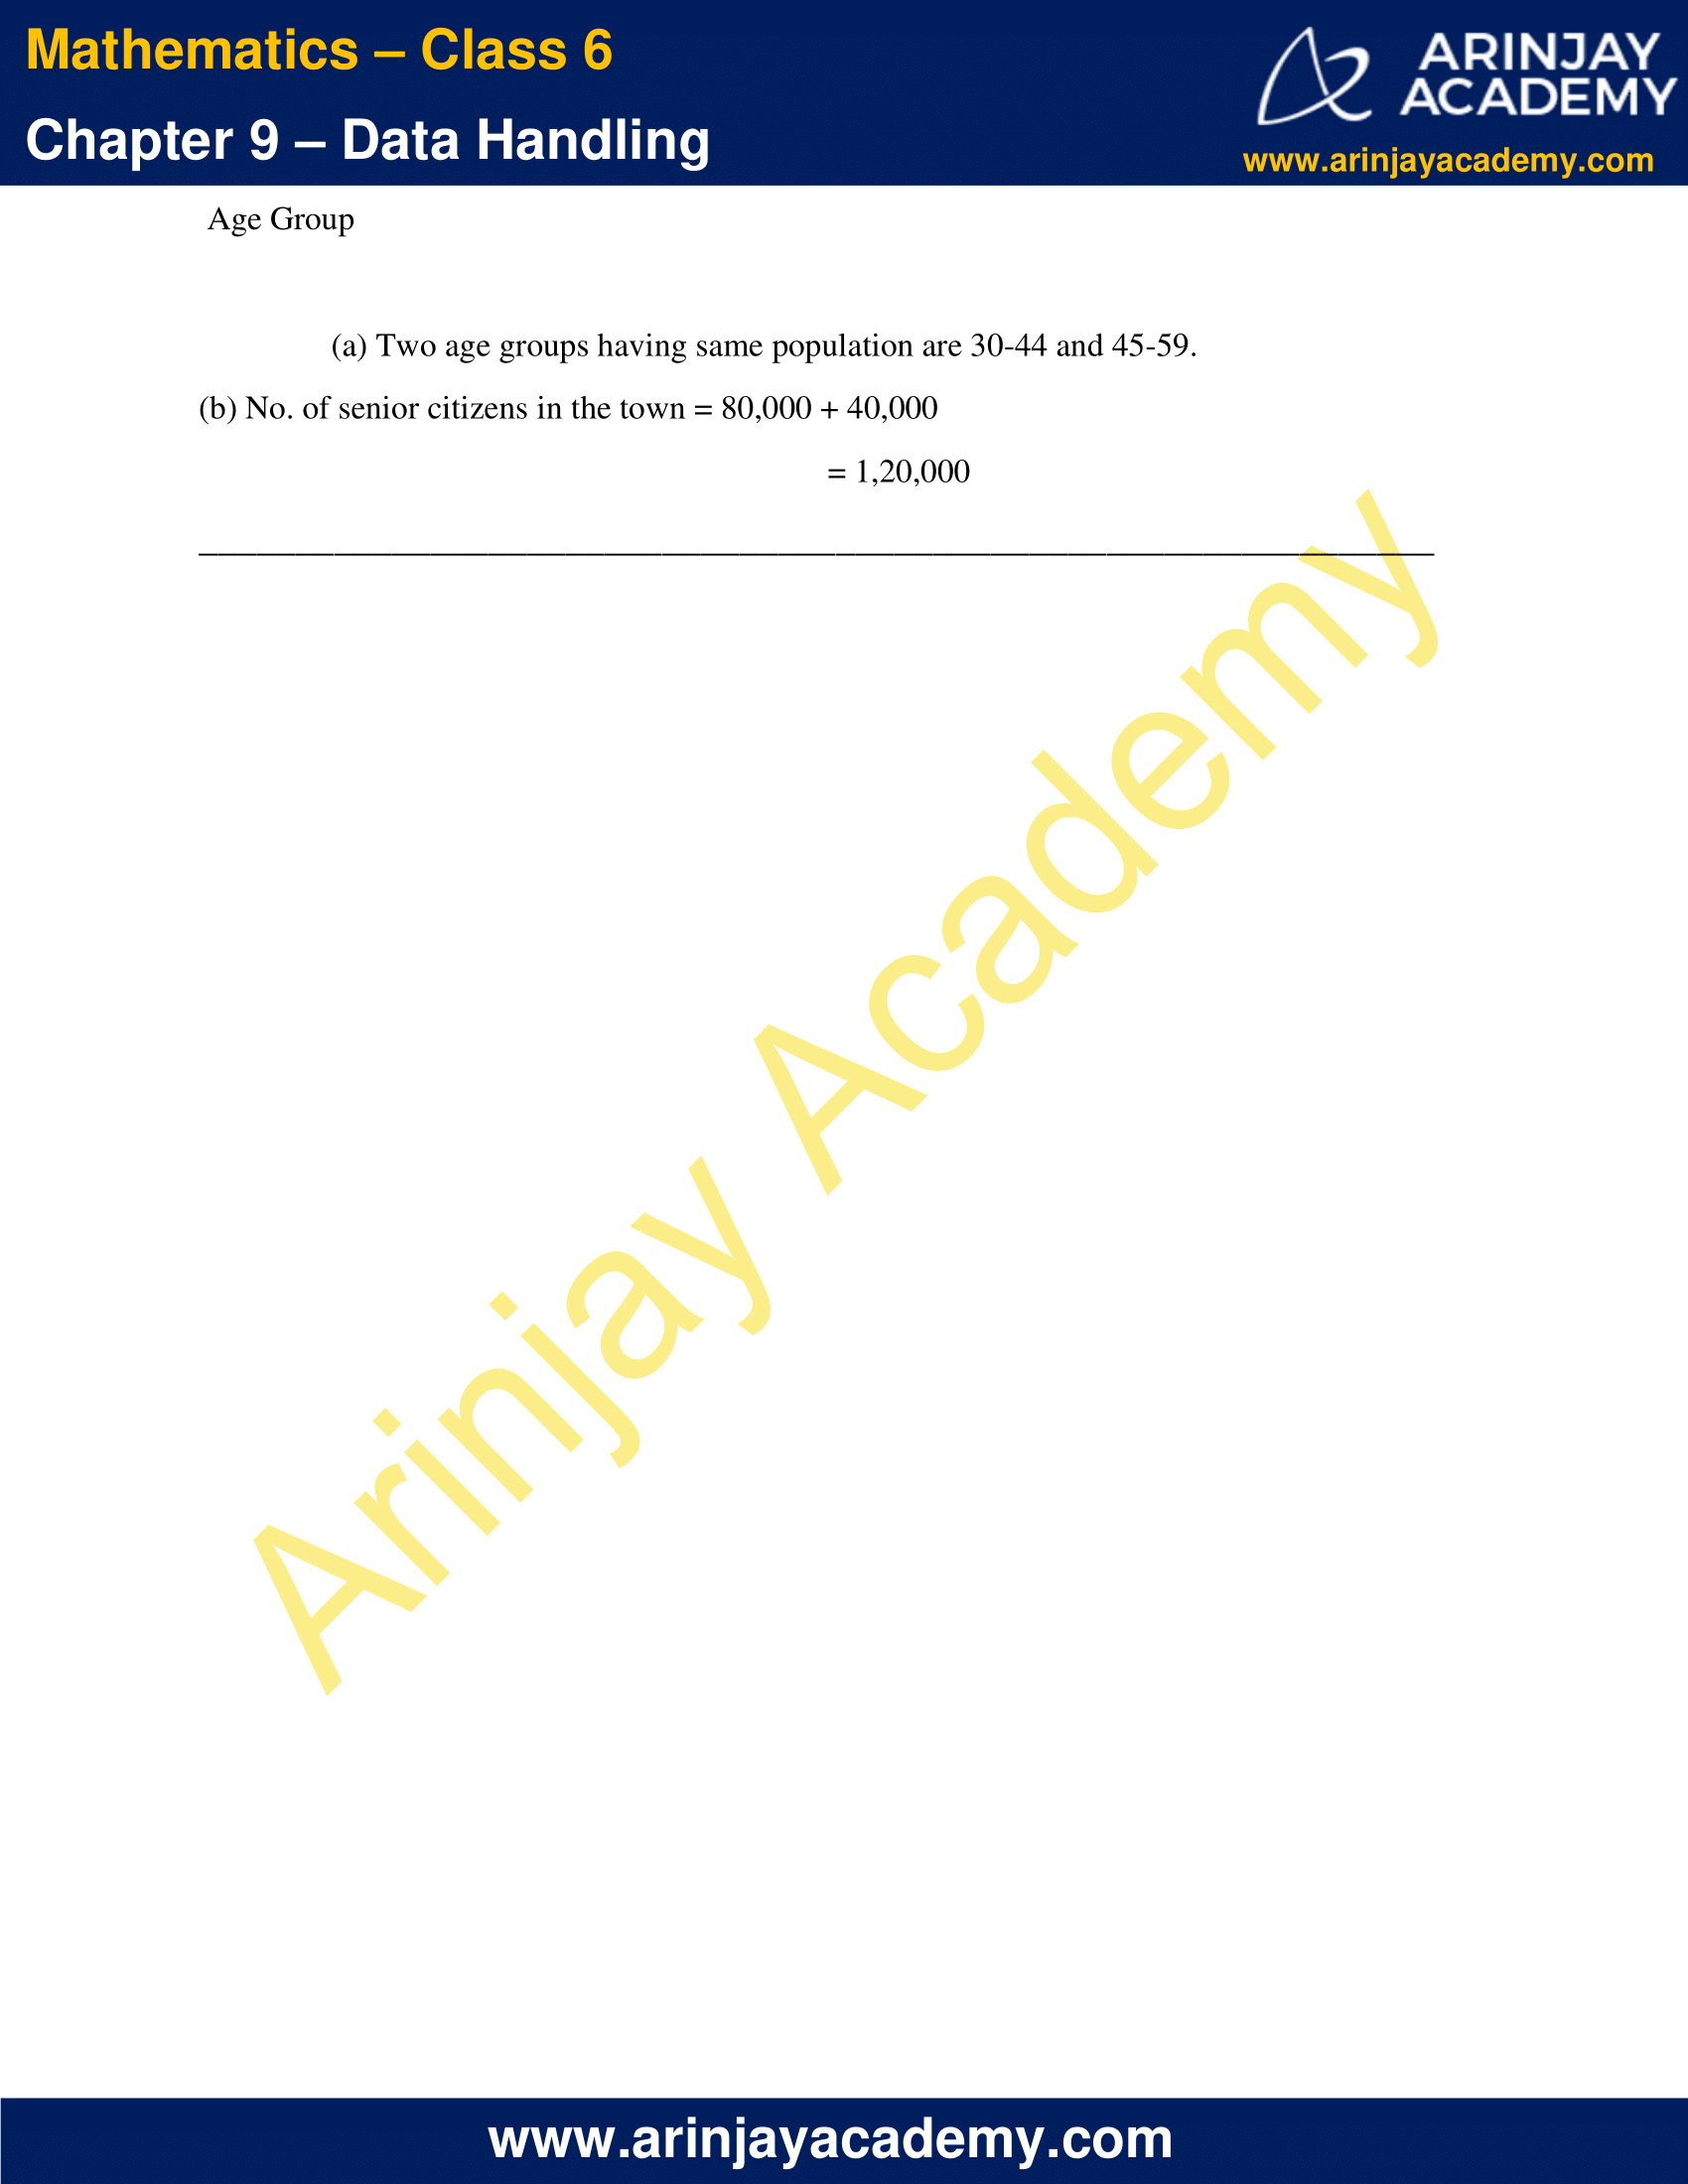
Ques. 3. Catherine threw a dice 40 times and noted the number appearing each time as shown below:
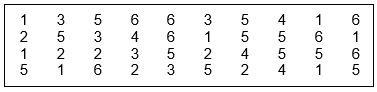
Make a table and enter the data using tally marks. Find the number that appeared.
(a) The minimum number of times
(b) The maximum number of times
(c) Find those numbers that appear an equal number of times.
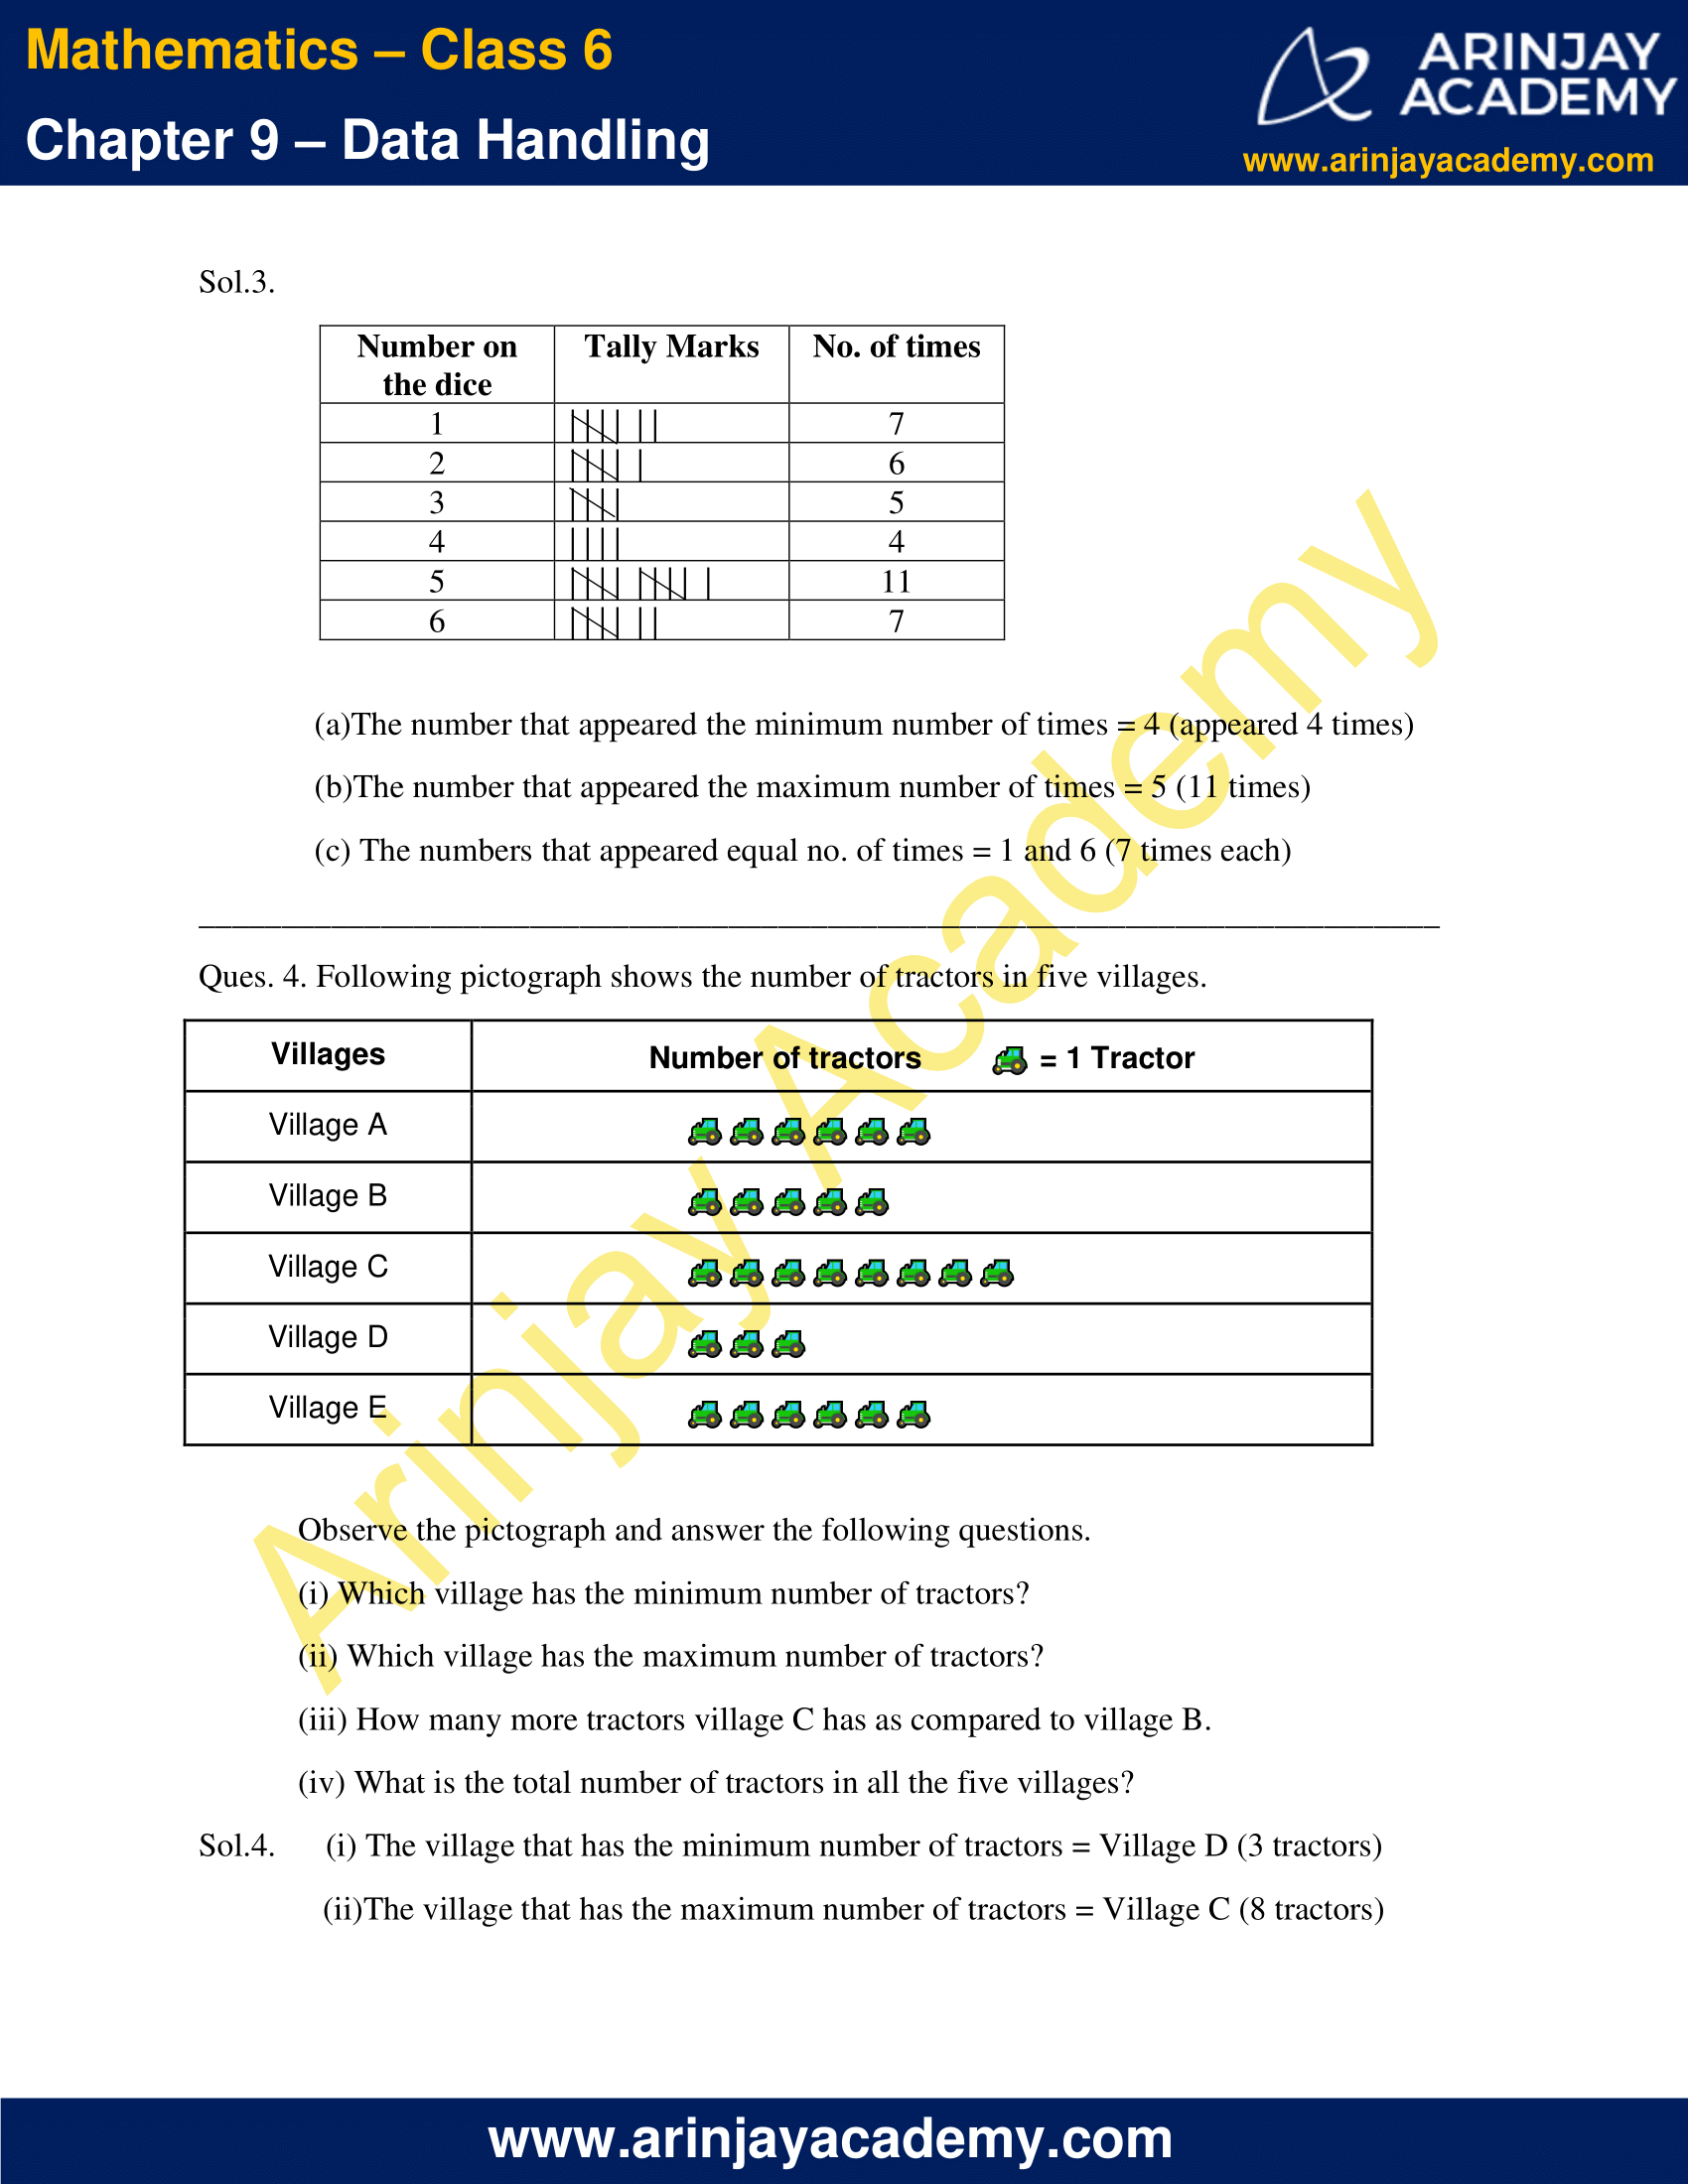
Sol.3.
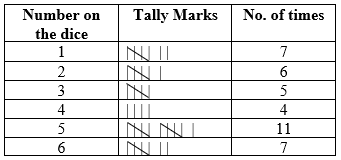
(a) The number that appeared the minimum number of times = 4 (appeared 4 times)
(b) The number that appeared the maximum number of times = 5 (11 times)
(c) The numbers that appeared equal no. of times = 1 and 6 (7 times each)
Ques. 4. Following pictograph shows the number of tractors in five villages.
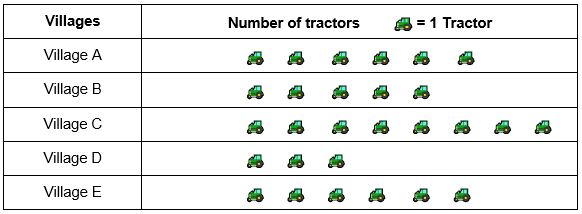
Observe the pictograph and answer the following questions.
(i) Which village has the minimum number of tractors?
(ii) Which village has the maximum number of tractors?
(iii) How many more tractors village C has as compared to village B.
(iv) What is the total number of tractors in all the five villages?
Sol.4. (i) The village that has the minimum number of tractors = Village D (3 tractors)
(ii) The village that has the maximum number of tractors = Village C (8 tractors)
(iii) Village C has 8 tractors.
Village B has 5 tractors.
Hence, village C has 3 more tractors than village B.
(iv) Total no. of tractors in all the 5 villages
= No. of tractors in village (A + B + C + D + E)
= 6 + 5 + 8 + 3 + 6
= 28
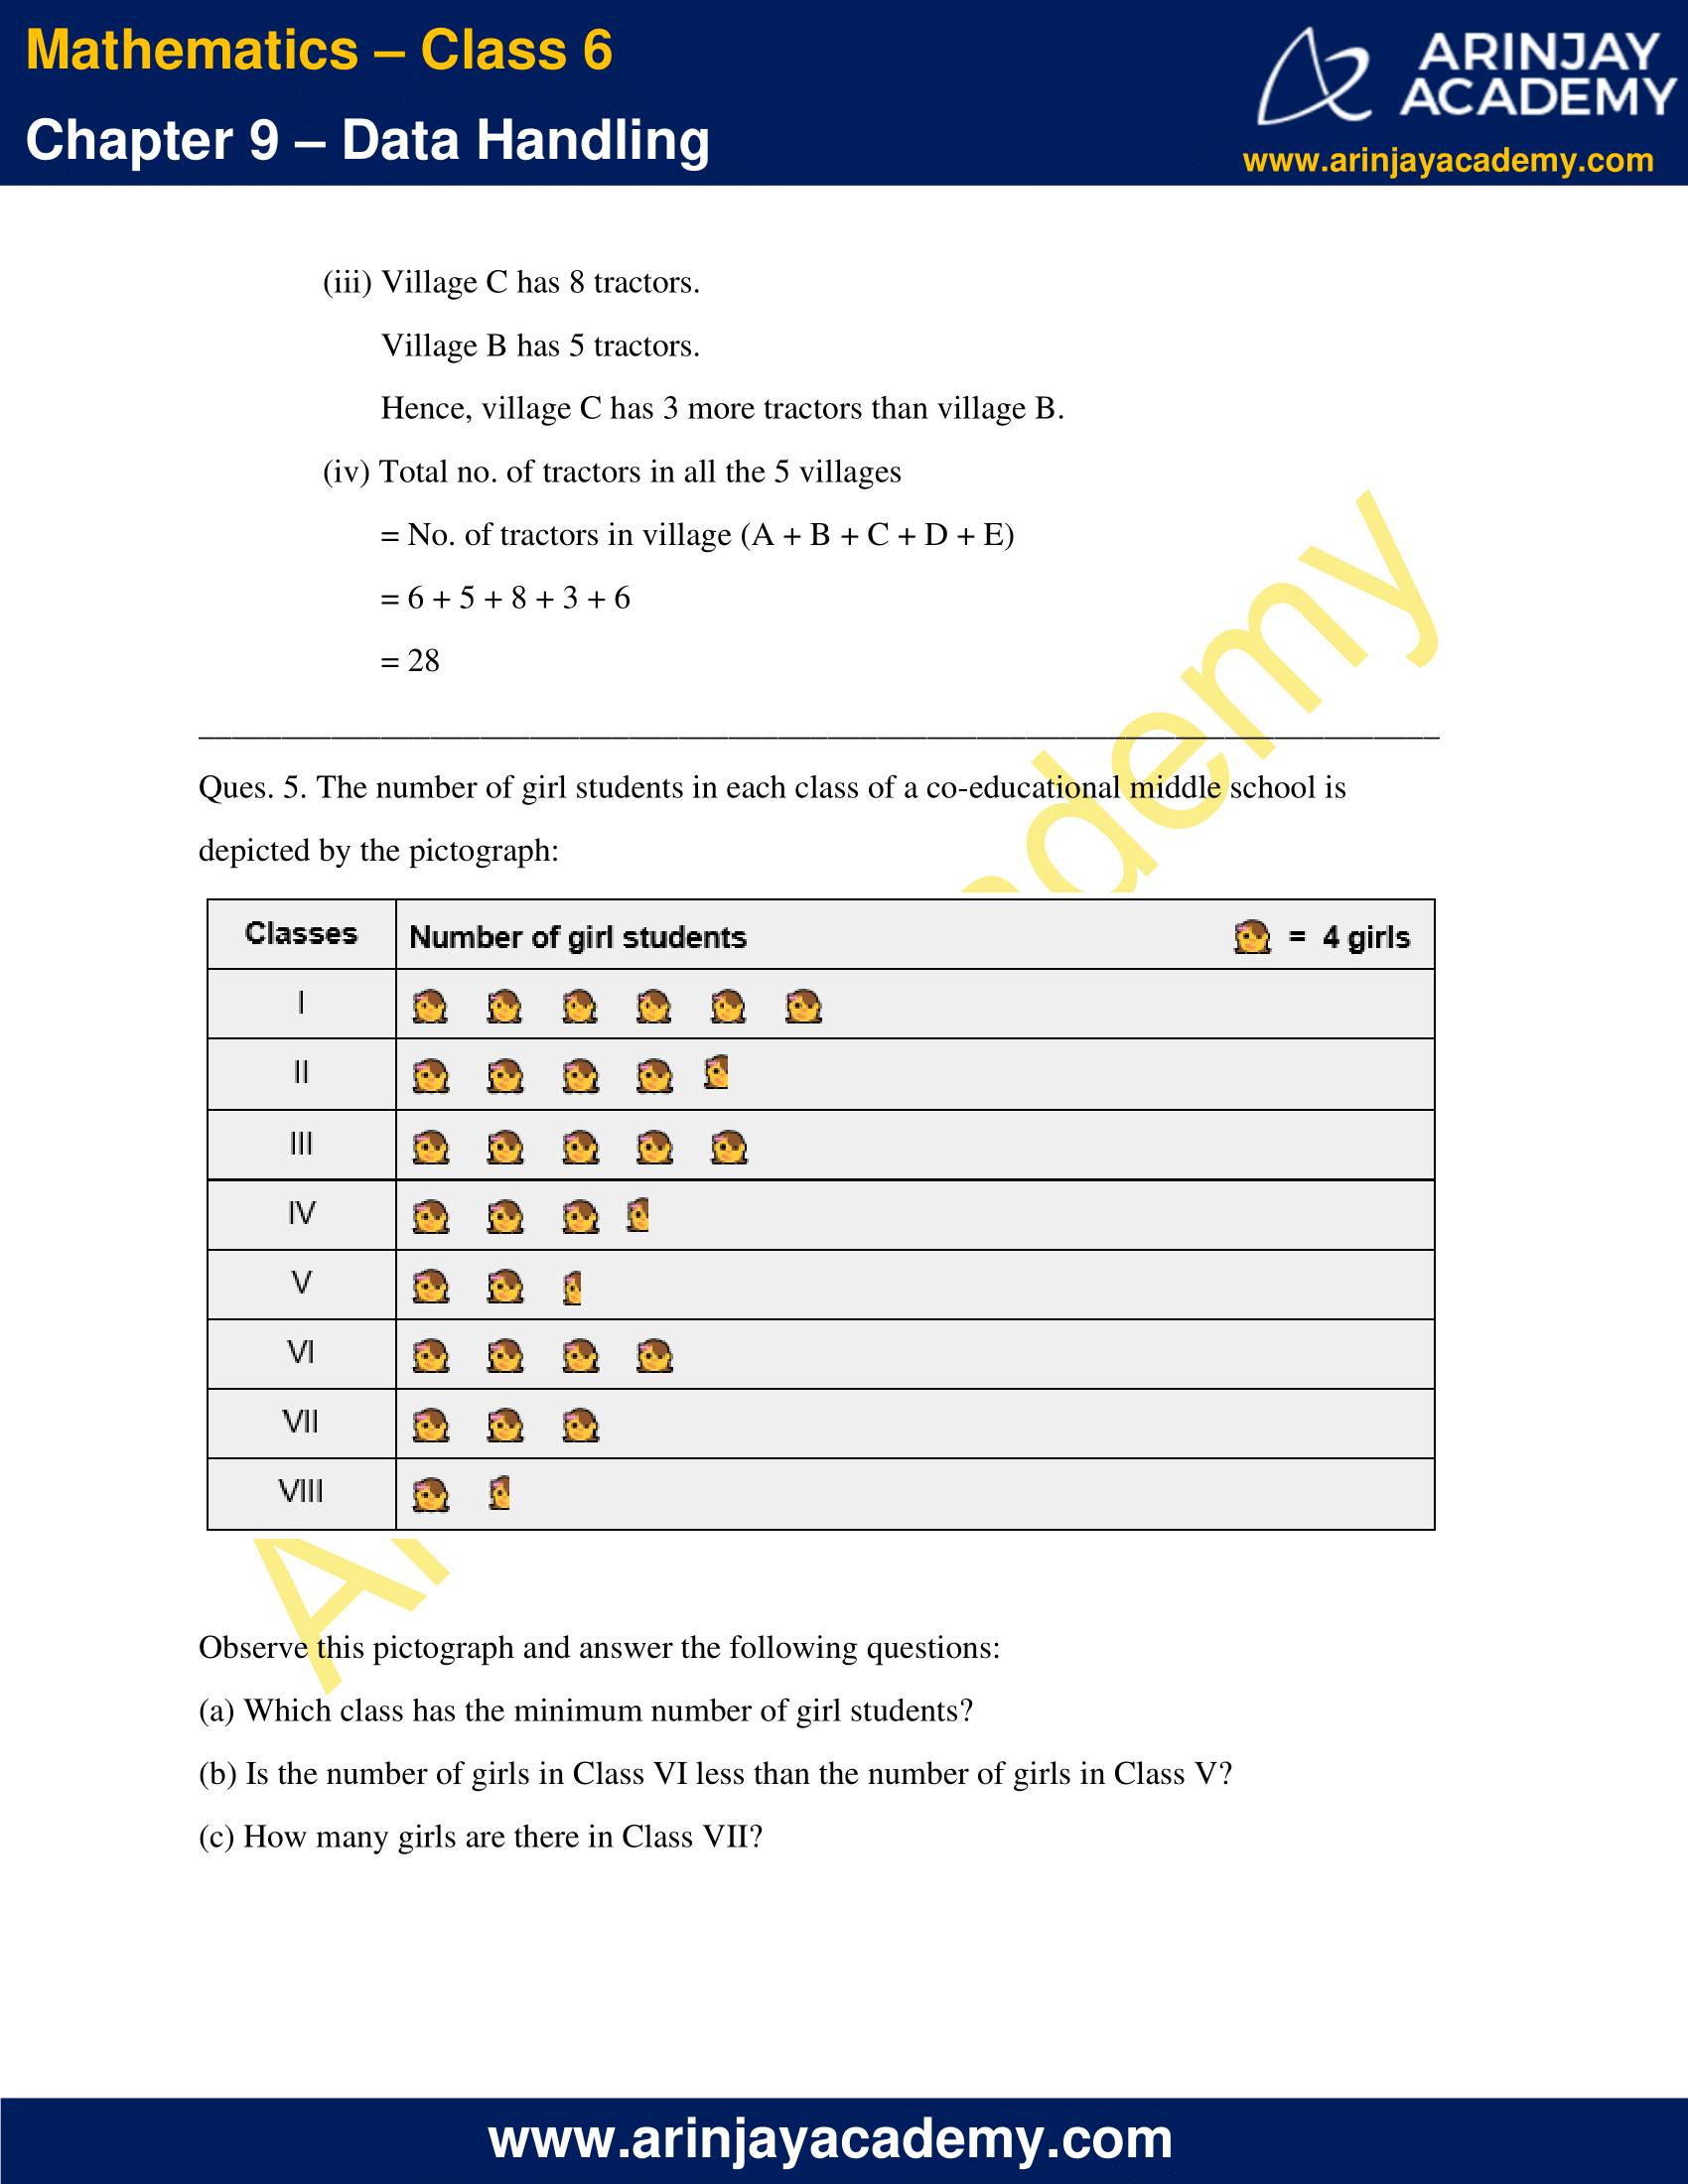
Ques. 5. The number of girl students in each class of a co-educational middle school is depicted by the pictograph:

Observe this pictograph and answer the following questions:
(a) Which class has the minimum number of girl students?
(b) Is the number of girls in Class VI less than the number of girls in Class V?
(c) How many girls are there in Class VII?
Sol.5. (a) The class that has the minimum number of girl students = Class VIII
(4 + 2 =6 girl students)
(b) No. of girls in class VI = 4 × 4 = 16
No. of girls in class V = 4 × 2 + 2 = 10
Hence, the no. of girls in class VI are not less than the number of girls in Class V.
(c) No. of girls in class VII = 4 × 3 = 12
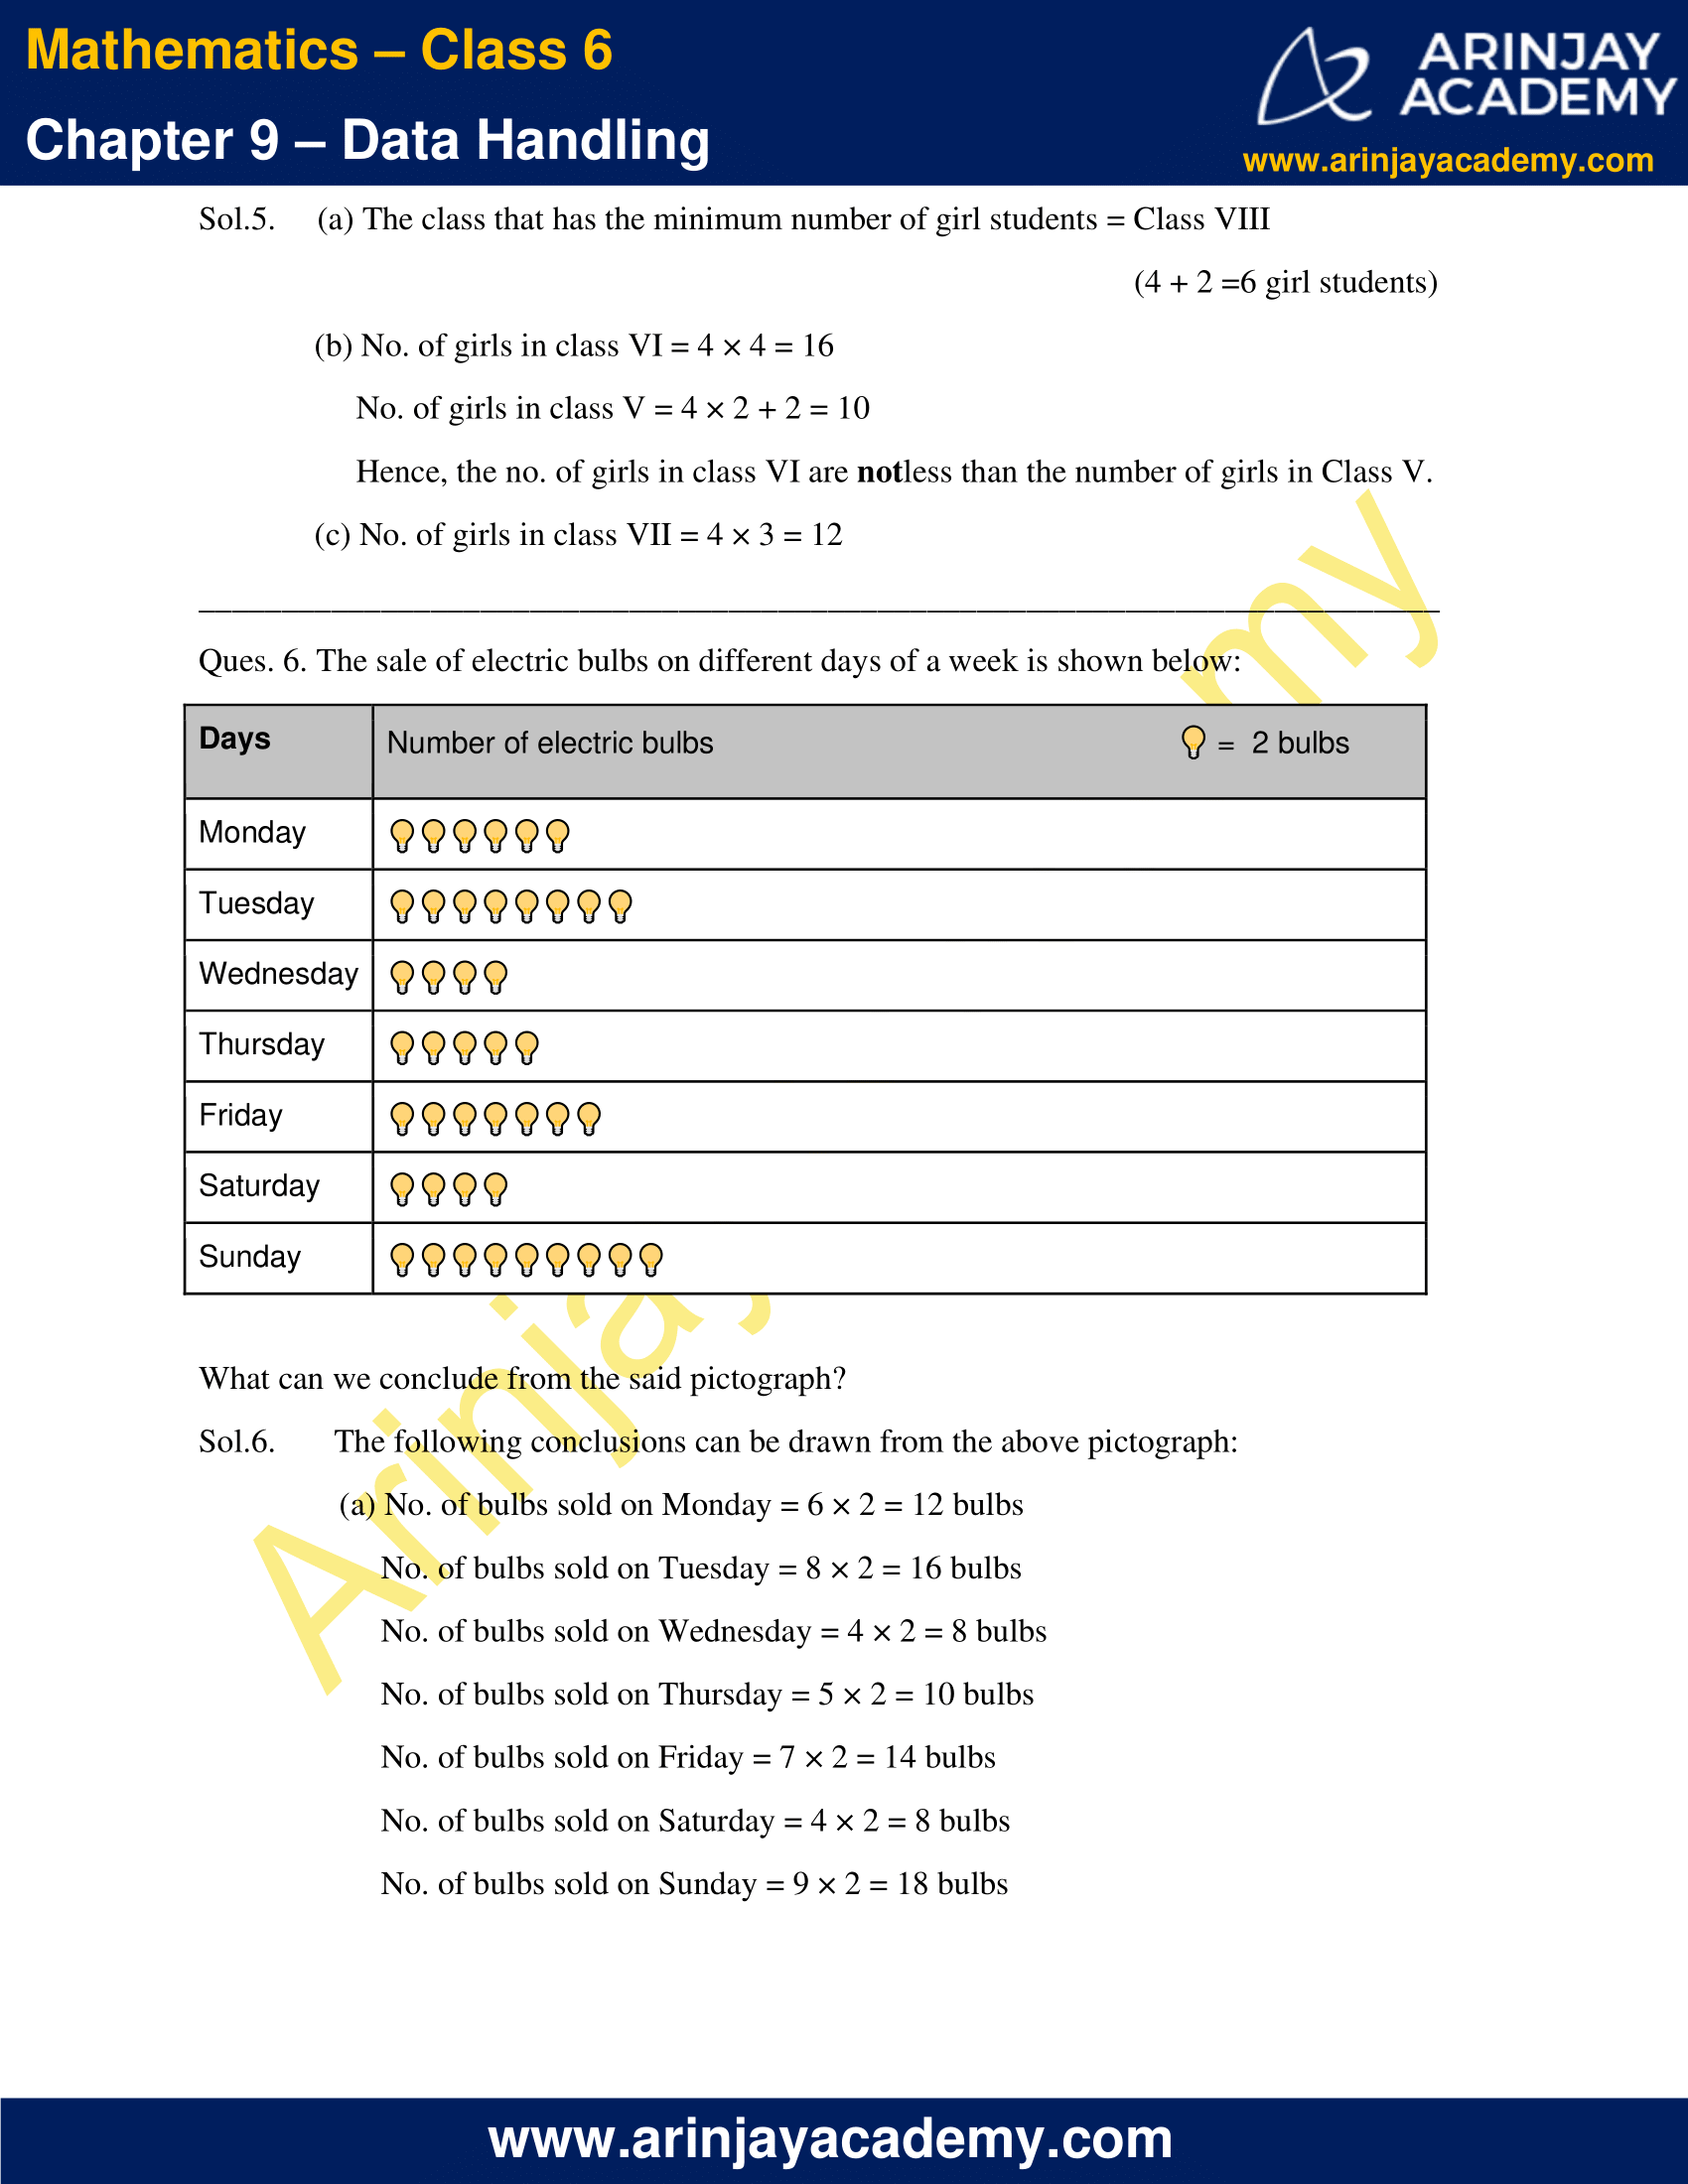
Ques. 6. The sale of electric bulbs on different days of a week is shown below:
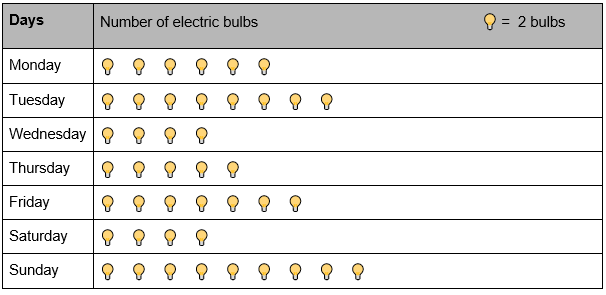
What can we conclude from the said pictograph?
Sol.6. The following conclusions can be drawn from the above pictograph:
(a) No. of bulbs sold on Monday = 6 × 2 = 12 bulbs
No. of bulbs sold on Tuesday = 8 × 2 = 16 bulbs
No. of bulbs sold on Wednesday = 4 × 2 = 8 bulbs
No. of bulbs sold on Thursday = 5 × 2 = 10 bulbs
No. of bulbs sold on Friday = 7 × 2 = 14 bulbs
No. of bulbs sold on Saturday = 4 × 2 = 8 bulbs
No. of bulbs sold on Sunday = 9 × 2 = 18 bulbs
(b) Total no. of bulbs sold in a week = 12 + 16 + 8 + 10 + 14 + 8 + 18
= 86 bulbs
(c) Equal no. of bulbs were sold on two days (Wednesday and Saturday).
(d) Maximum no. of bulbs were sold on Sunday (18 bulbs).
Minimum no. of bulbs were sold on Wednesday and Saturday (8 bulbs).
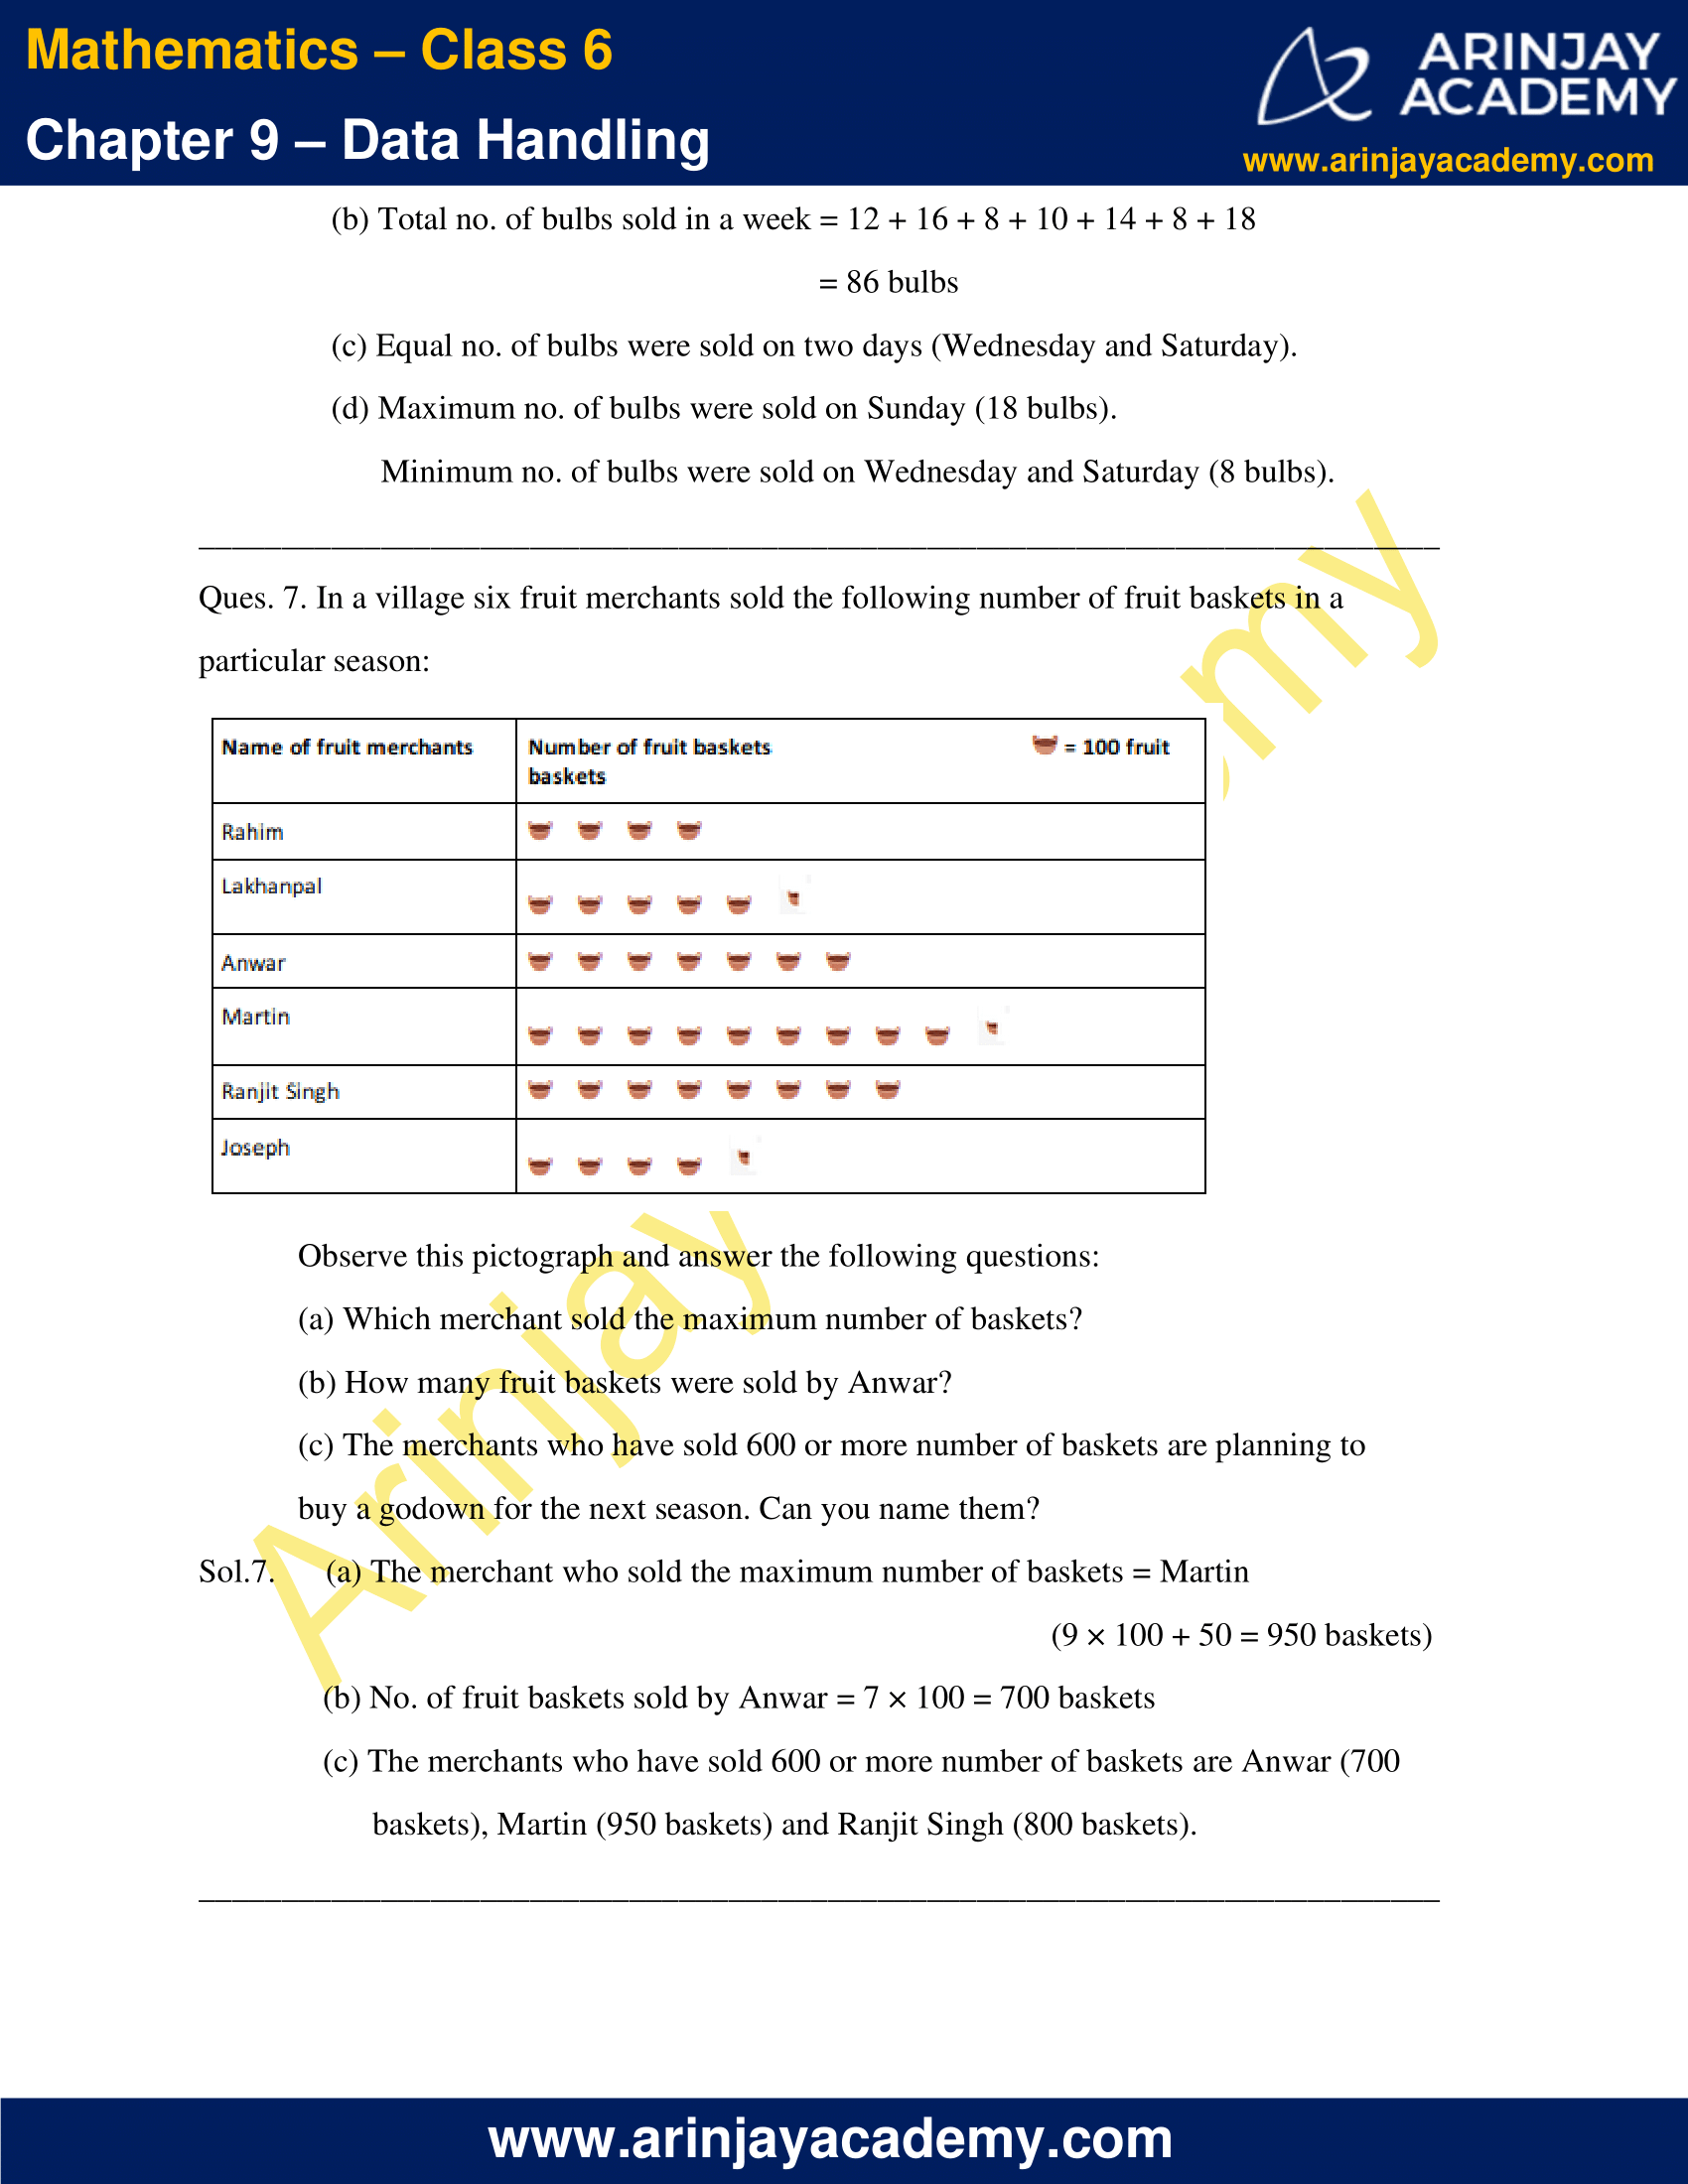
Ques. 7. In a village six fruit merchants sold the following number of fruit baskets in a particular season:
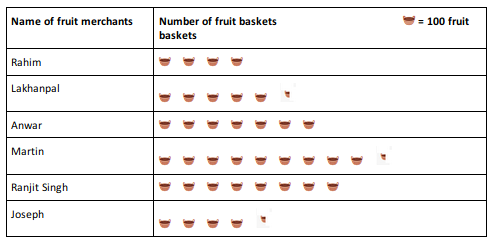
Observe this pictograph and answer the following questions:
(a) Which merchant sold the maximum number of baskets?
(b) How many fruit baskets were sold by Anwar?
(c) The merchants who have sold 600 or more number of baskets are planning to buy a godown for the next season. Can you name them?
Sol.7. (a) The merchant who sold the maximum number of baskets = Martin
(9 × 100 + 50 = 950 baskets)
(b) No. of fruit baskets sold by Anwar = 7 × 100 = 700 baskets
(c) The merchants who have sold 600 or more number of baskets are Anwar (700 baskets), Martin (950 baskets) and Ranjit Singh (800 baskets).
NCERT Solutions for Class 6 Maths Chapter 9 Exercise 9.2
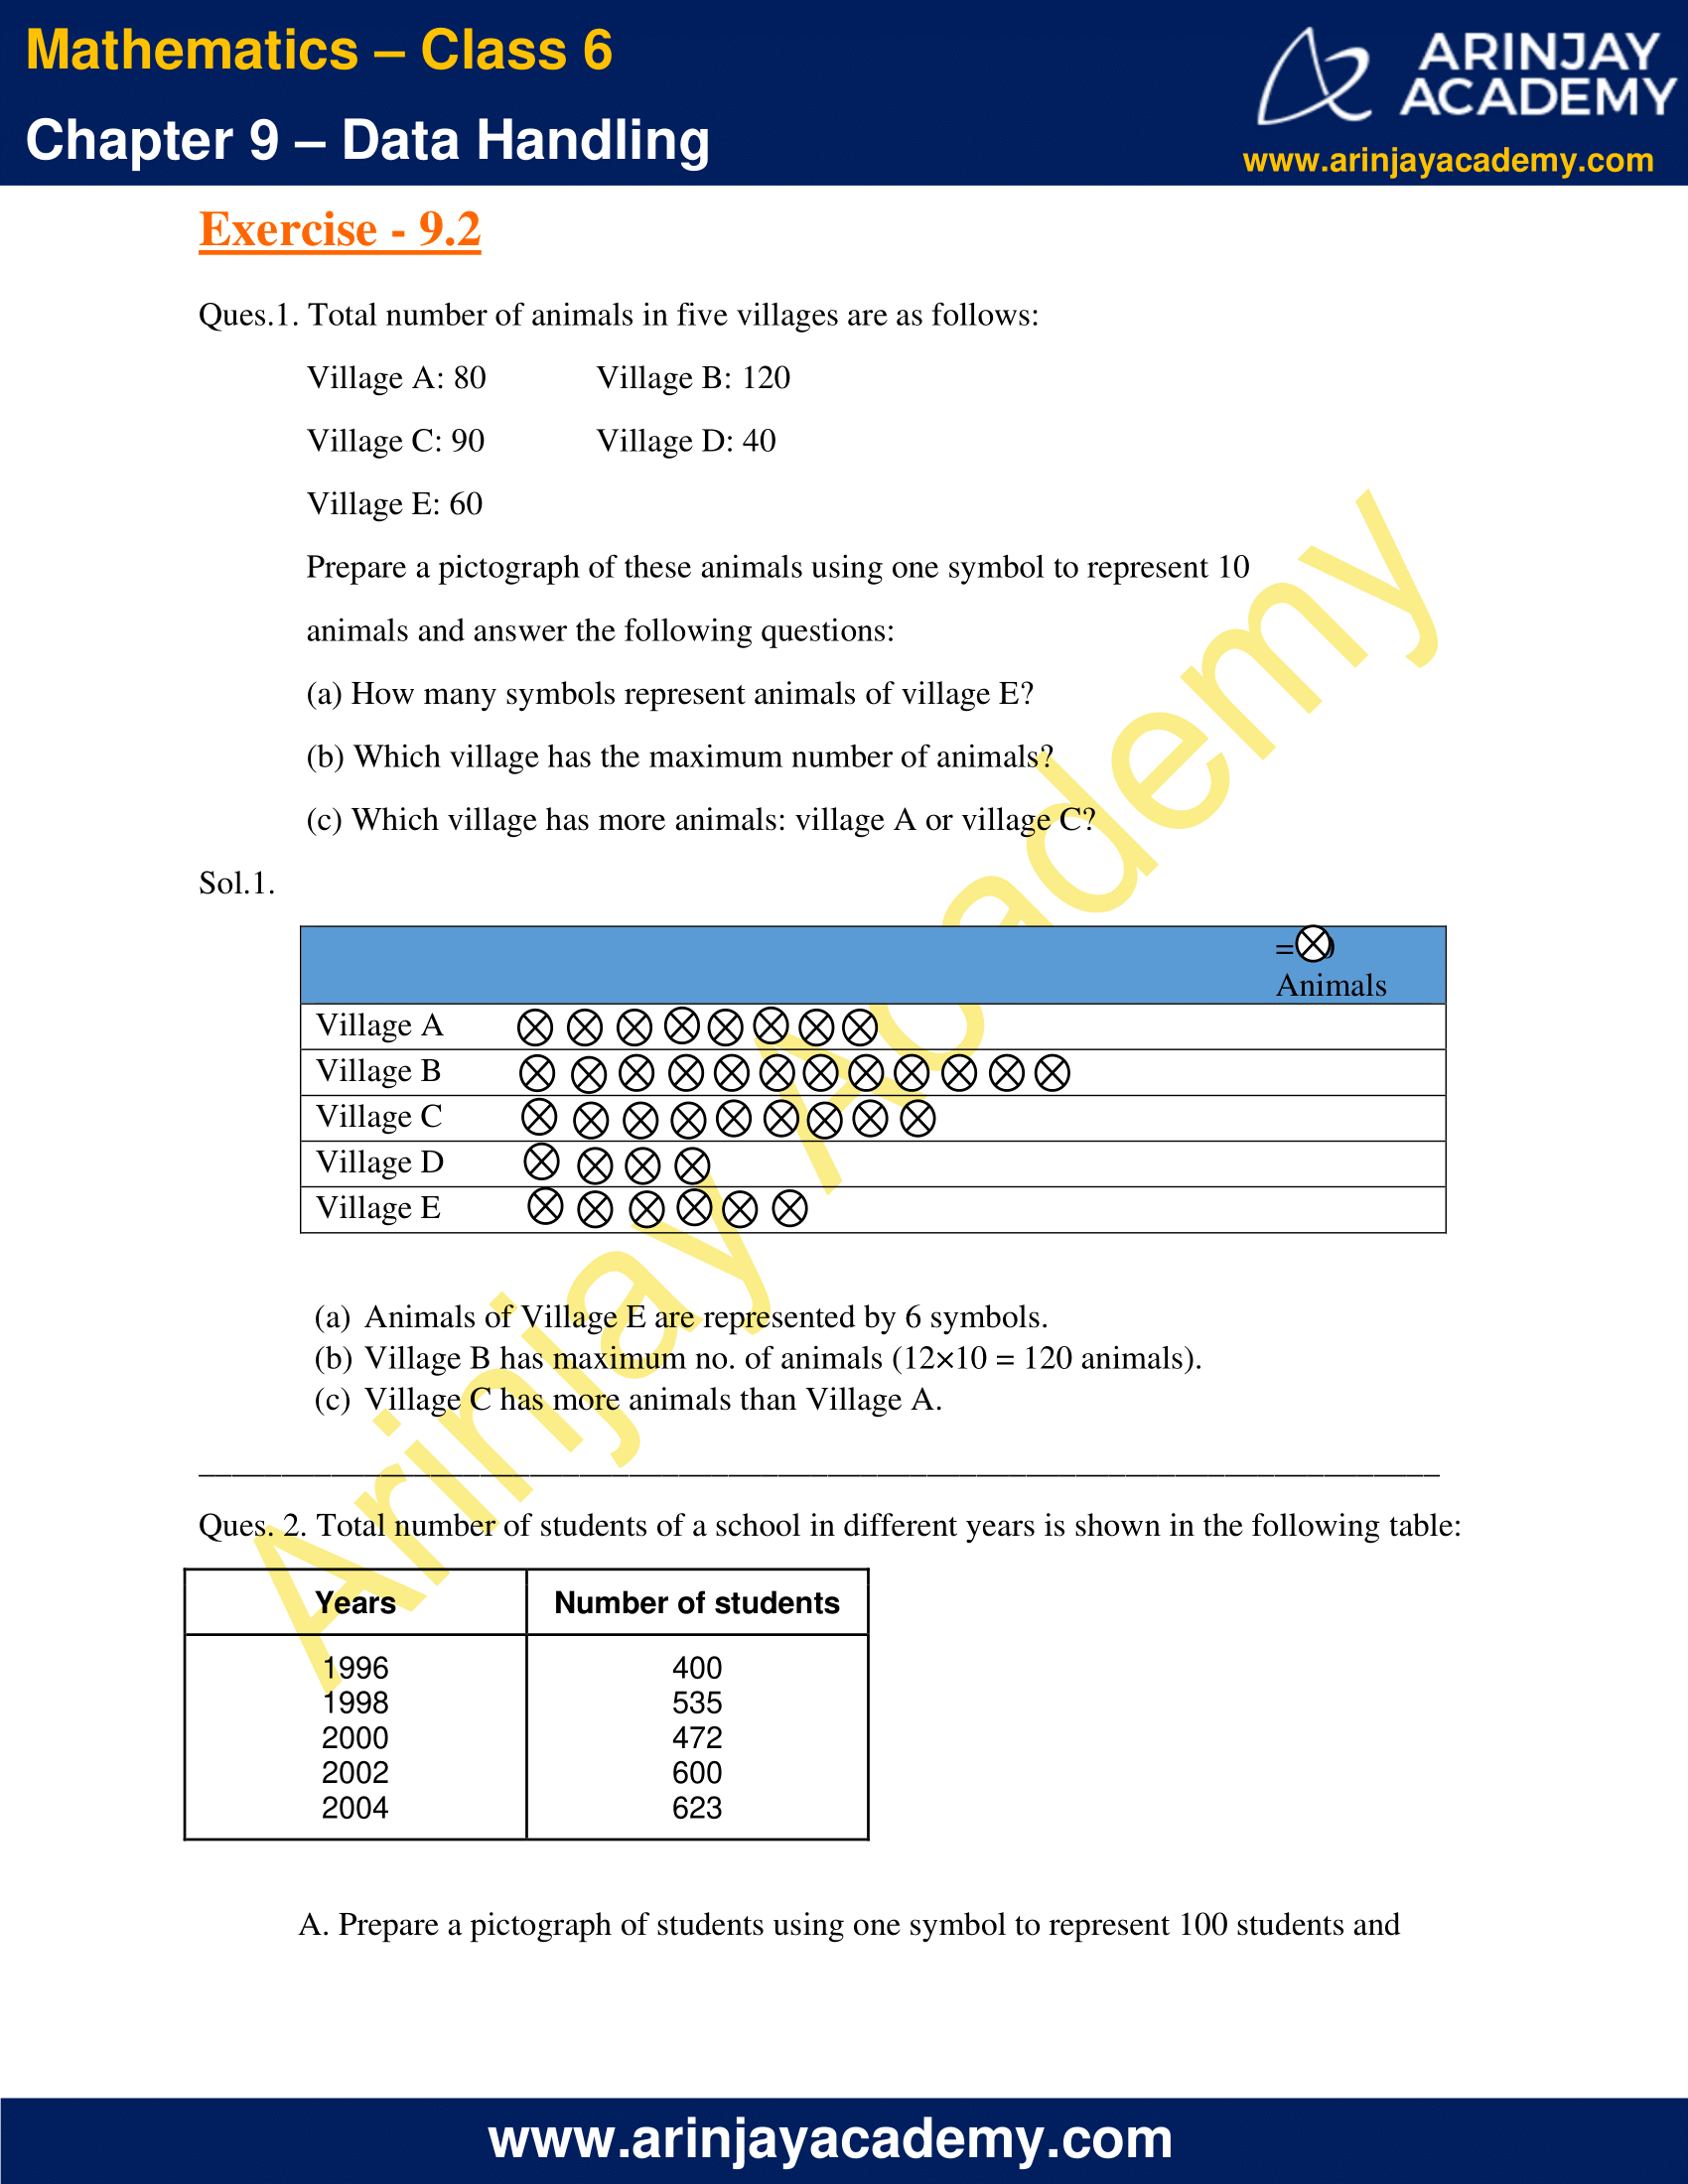
Ques.1. Total number of animals in five villages are as follows:
Village A: 80
Village B: 120
Village C: 90
Village D: 40
Village E: 60
Prepare a pictograph of these animals using one symbol to represent 10 animals and answer the following questions
(a) How many symbols represent animals of village E?
(b) Which village has the maximum number of animals?
(c) Which village has more animals: village A or village C?
Sol.1.
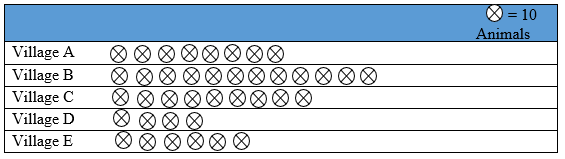
(a) Animals of Village E are represented by 6 symbols.
(b) Village B has maximum no. of animals (12×10 = 120 animals).
(c) Village C has more animals than Village A.
Ques. 2. Total number of students of a school in different years is shown in the following
Table:
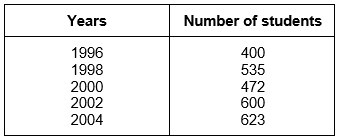
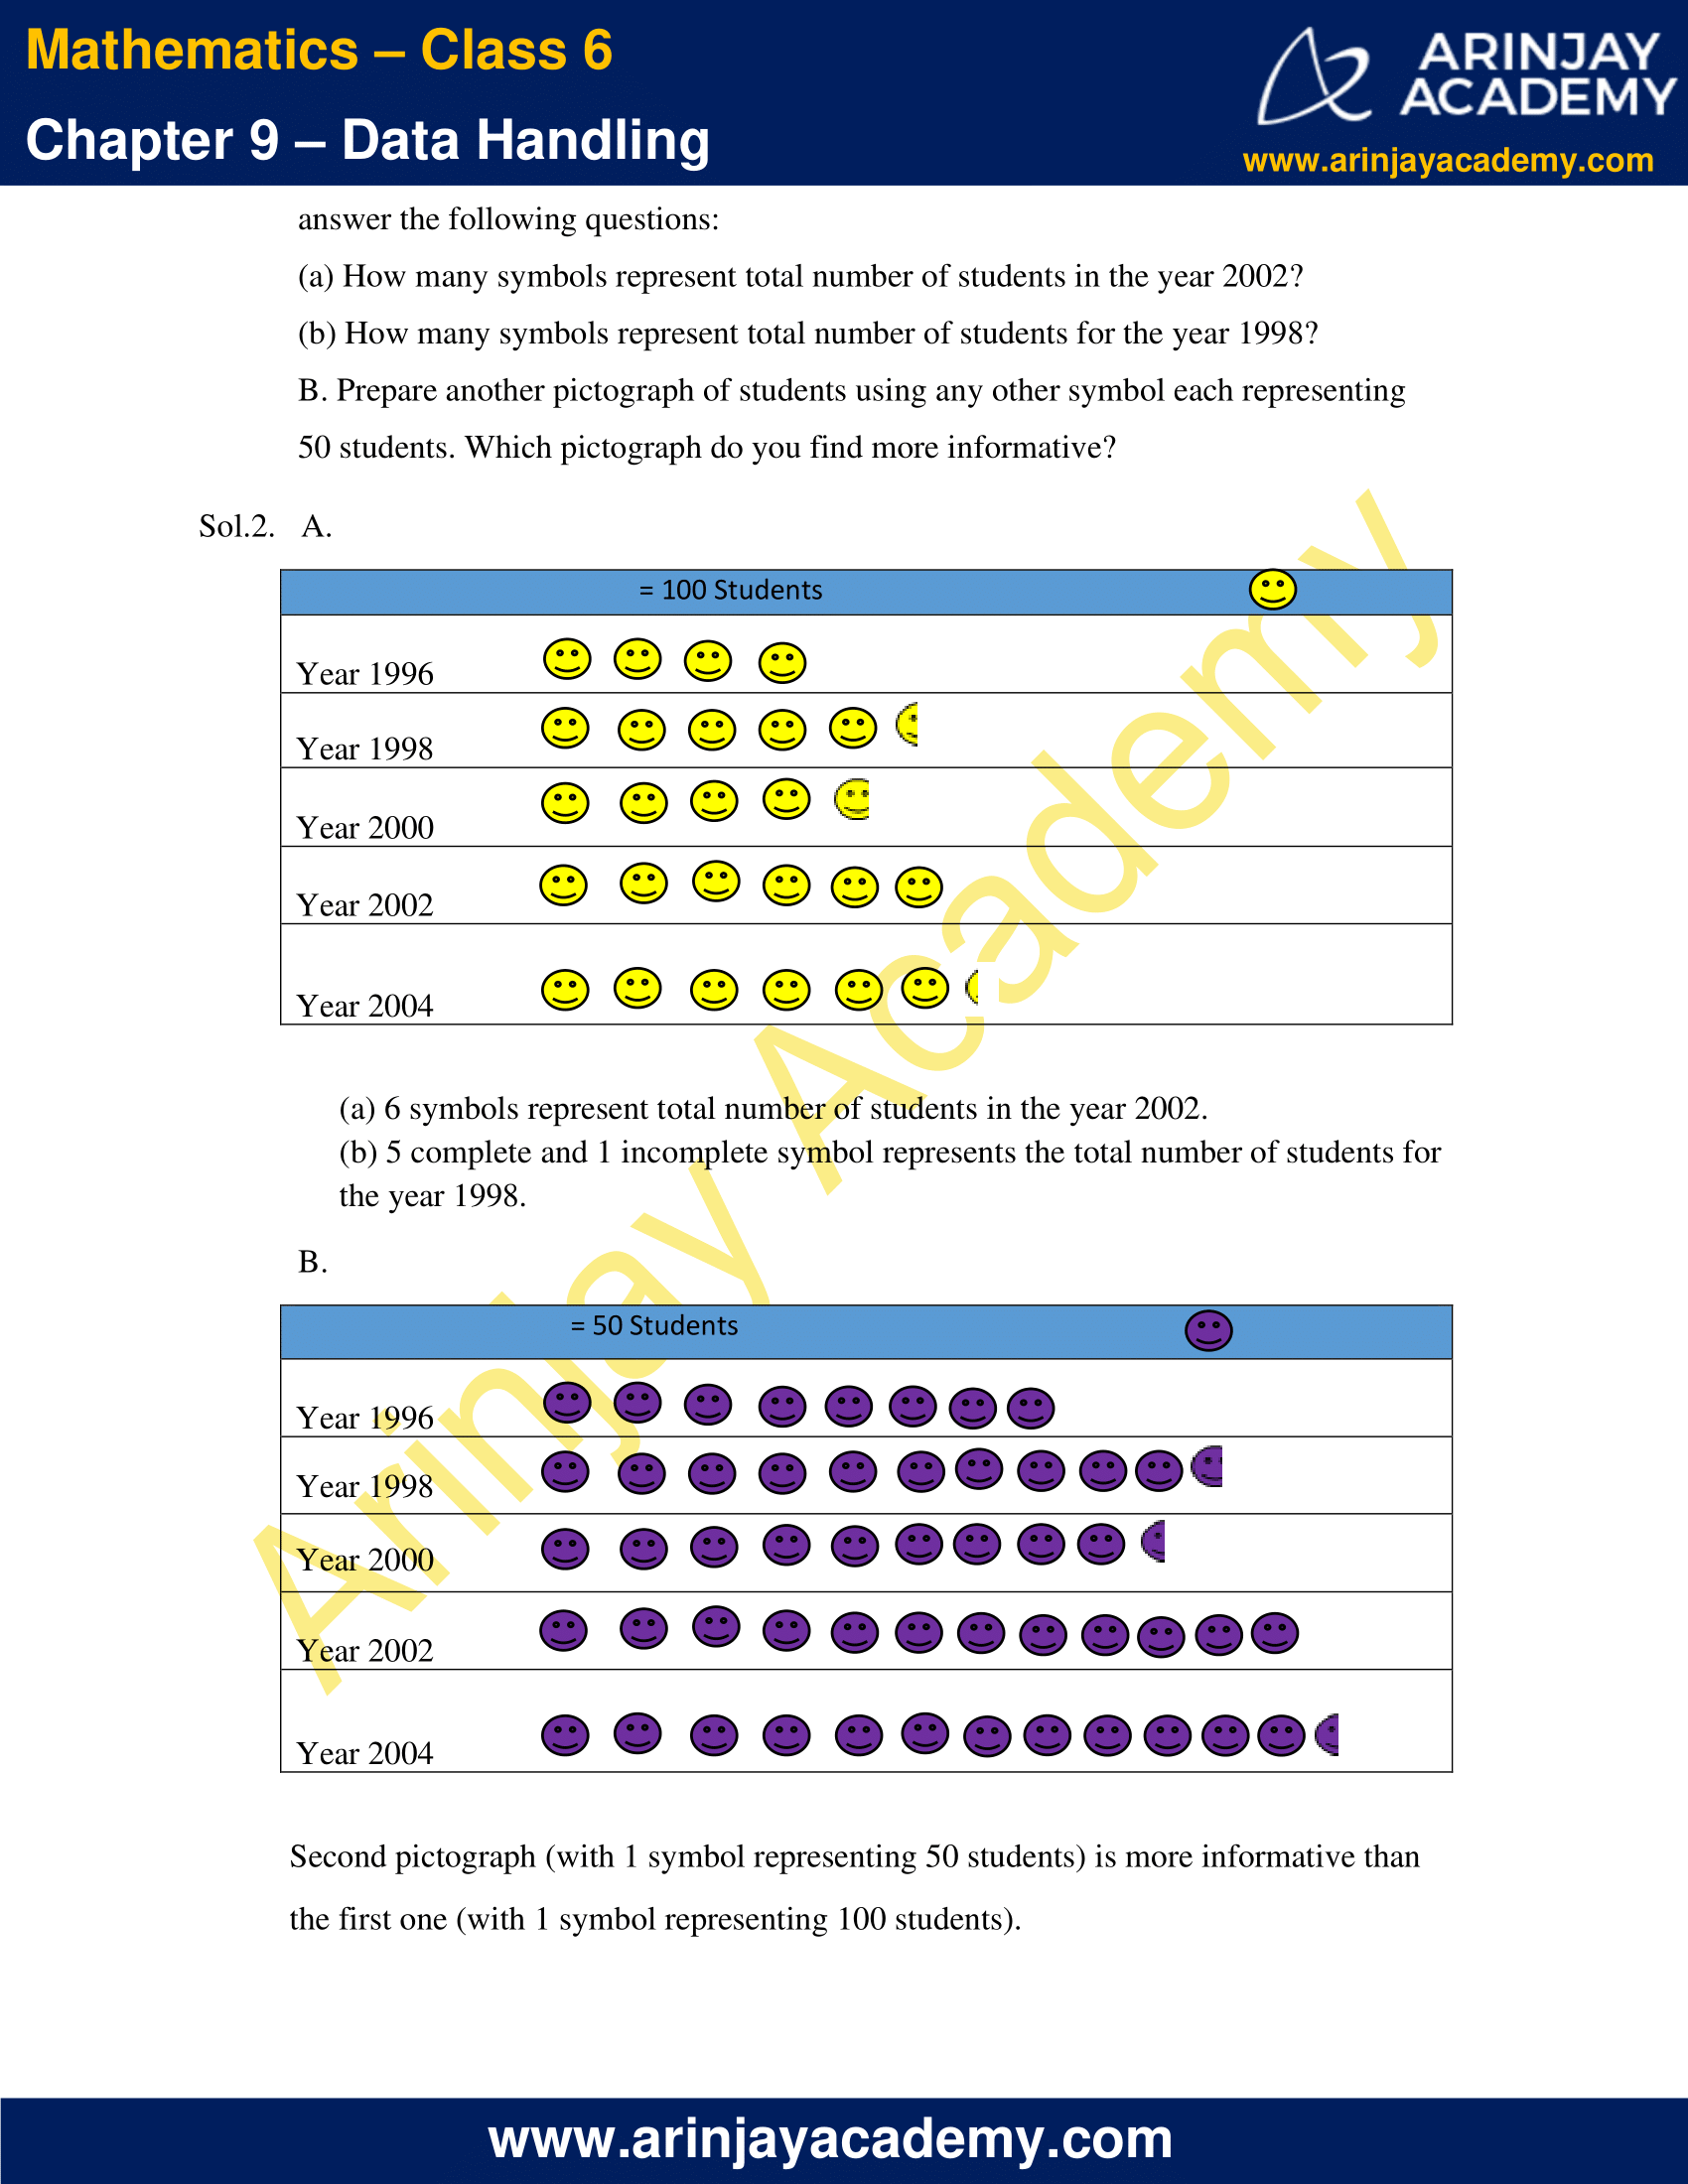
A. Prepare a pictograph of students using one symbol to represent 100 students and answer the following questions
(a) How many symbols represent total number of students in the year 2002?
(b) How many symbols represent total number of students for the year 1998?
B. Prepare another pictograph of students using any other symbol each representing 50 students. Which pictograph do you find more informative?
Sol.2. A.
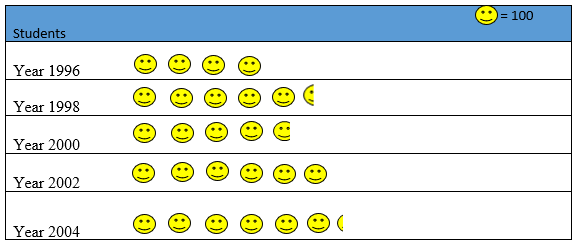
(a) 6 symbols represent total number of students in the year 2002.
(b) 5 complete and 1 incomplete symbol represents the total number of students for the year 1998.
B.
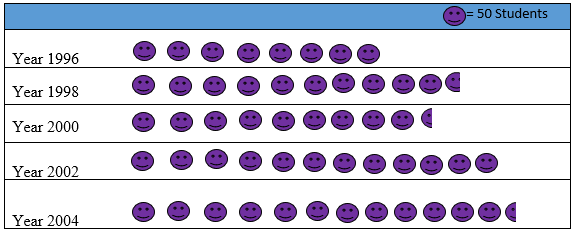
Second pictograph (with 1 symbol representing 50 students) is more informative than the first one (with 1 symbol representing 100 students).
NCERT Solutions for Class 6 Maths Chapter 9 Exercise 9.3
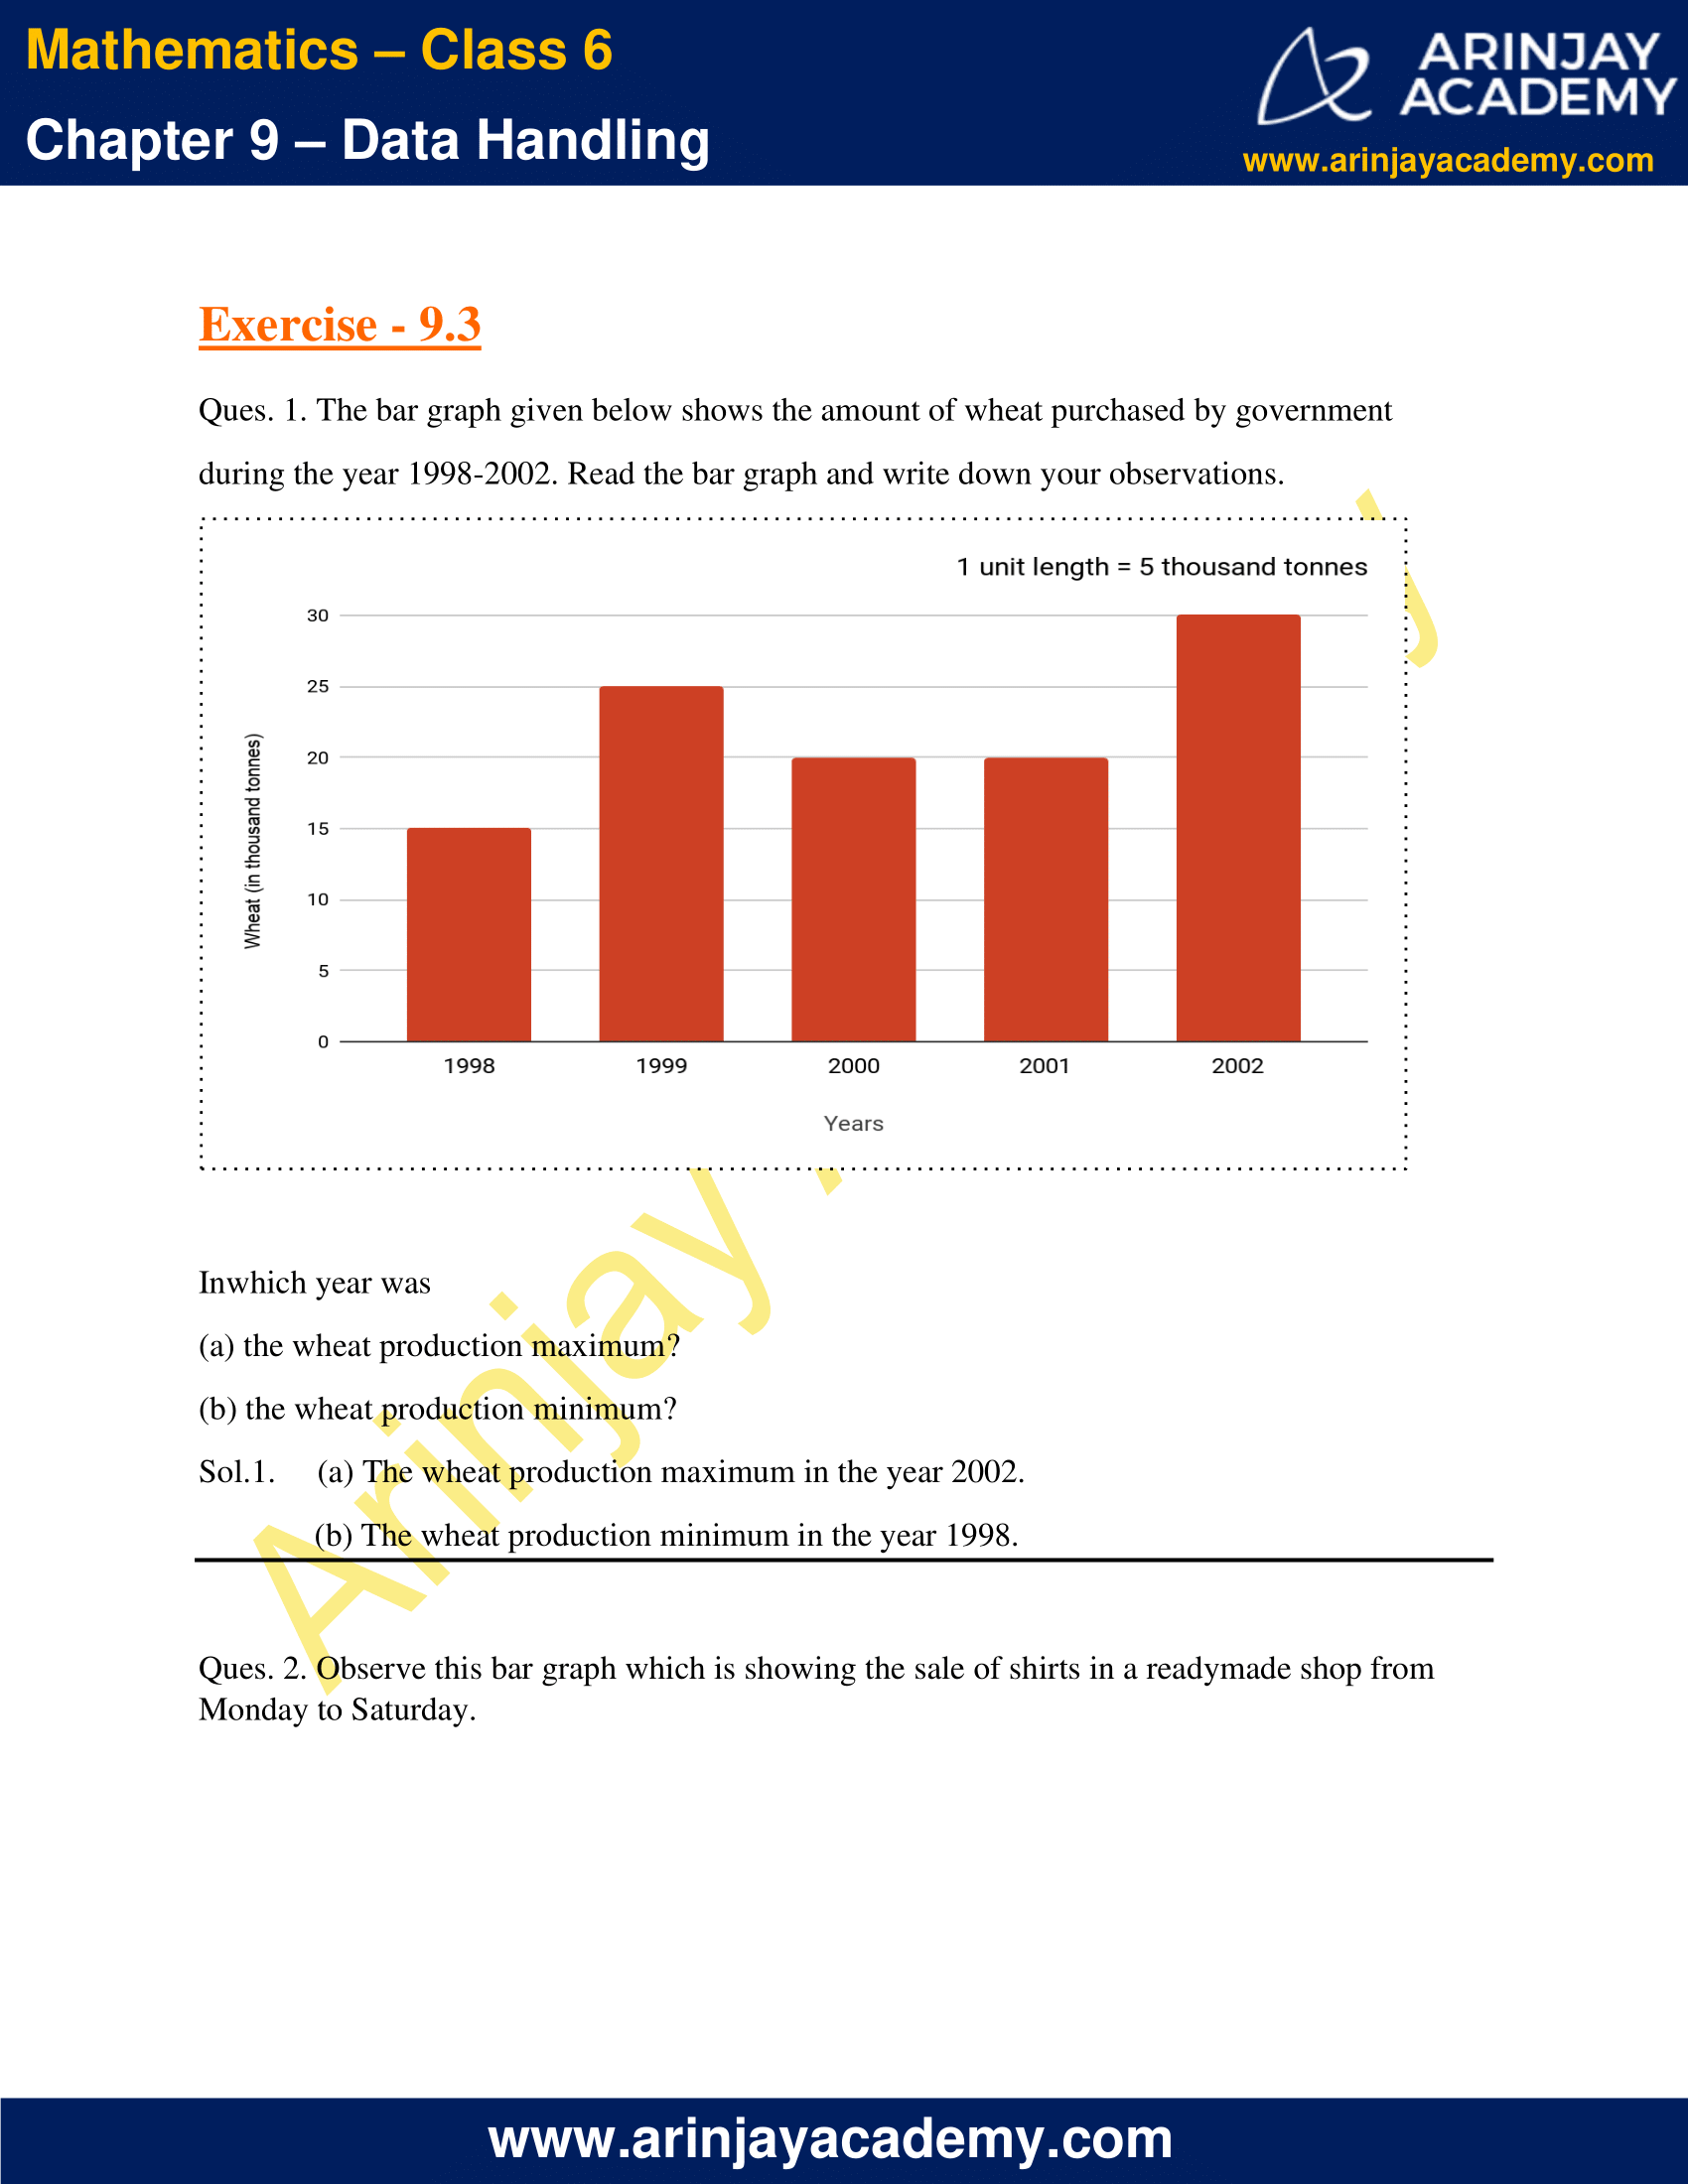
Ques. 1. The bar graph given below shows the amount of wheat purchased by government during the year 1998-2002. Read the bar graph and write down your observations.
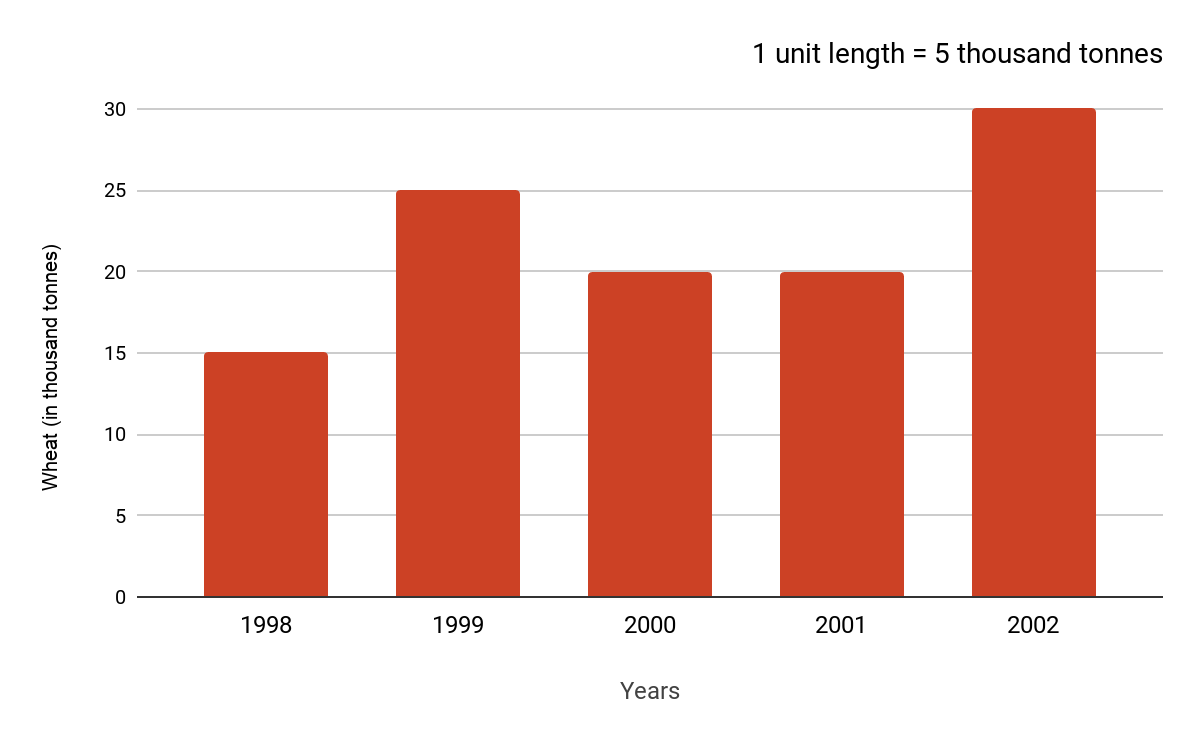
In which year was
(a) the wheat production maximum?
(b) the wheat production minimum?
Sol.1. (a) The wheat production maximum in the year 2002.
(b) The wheat production minimum in the year 1998.
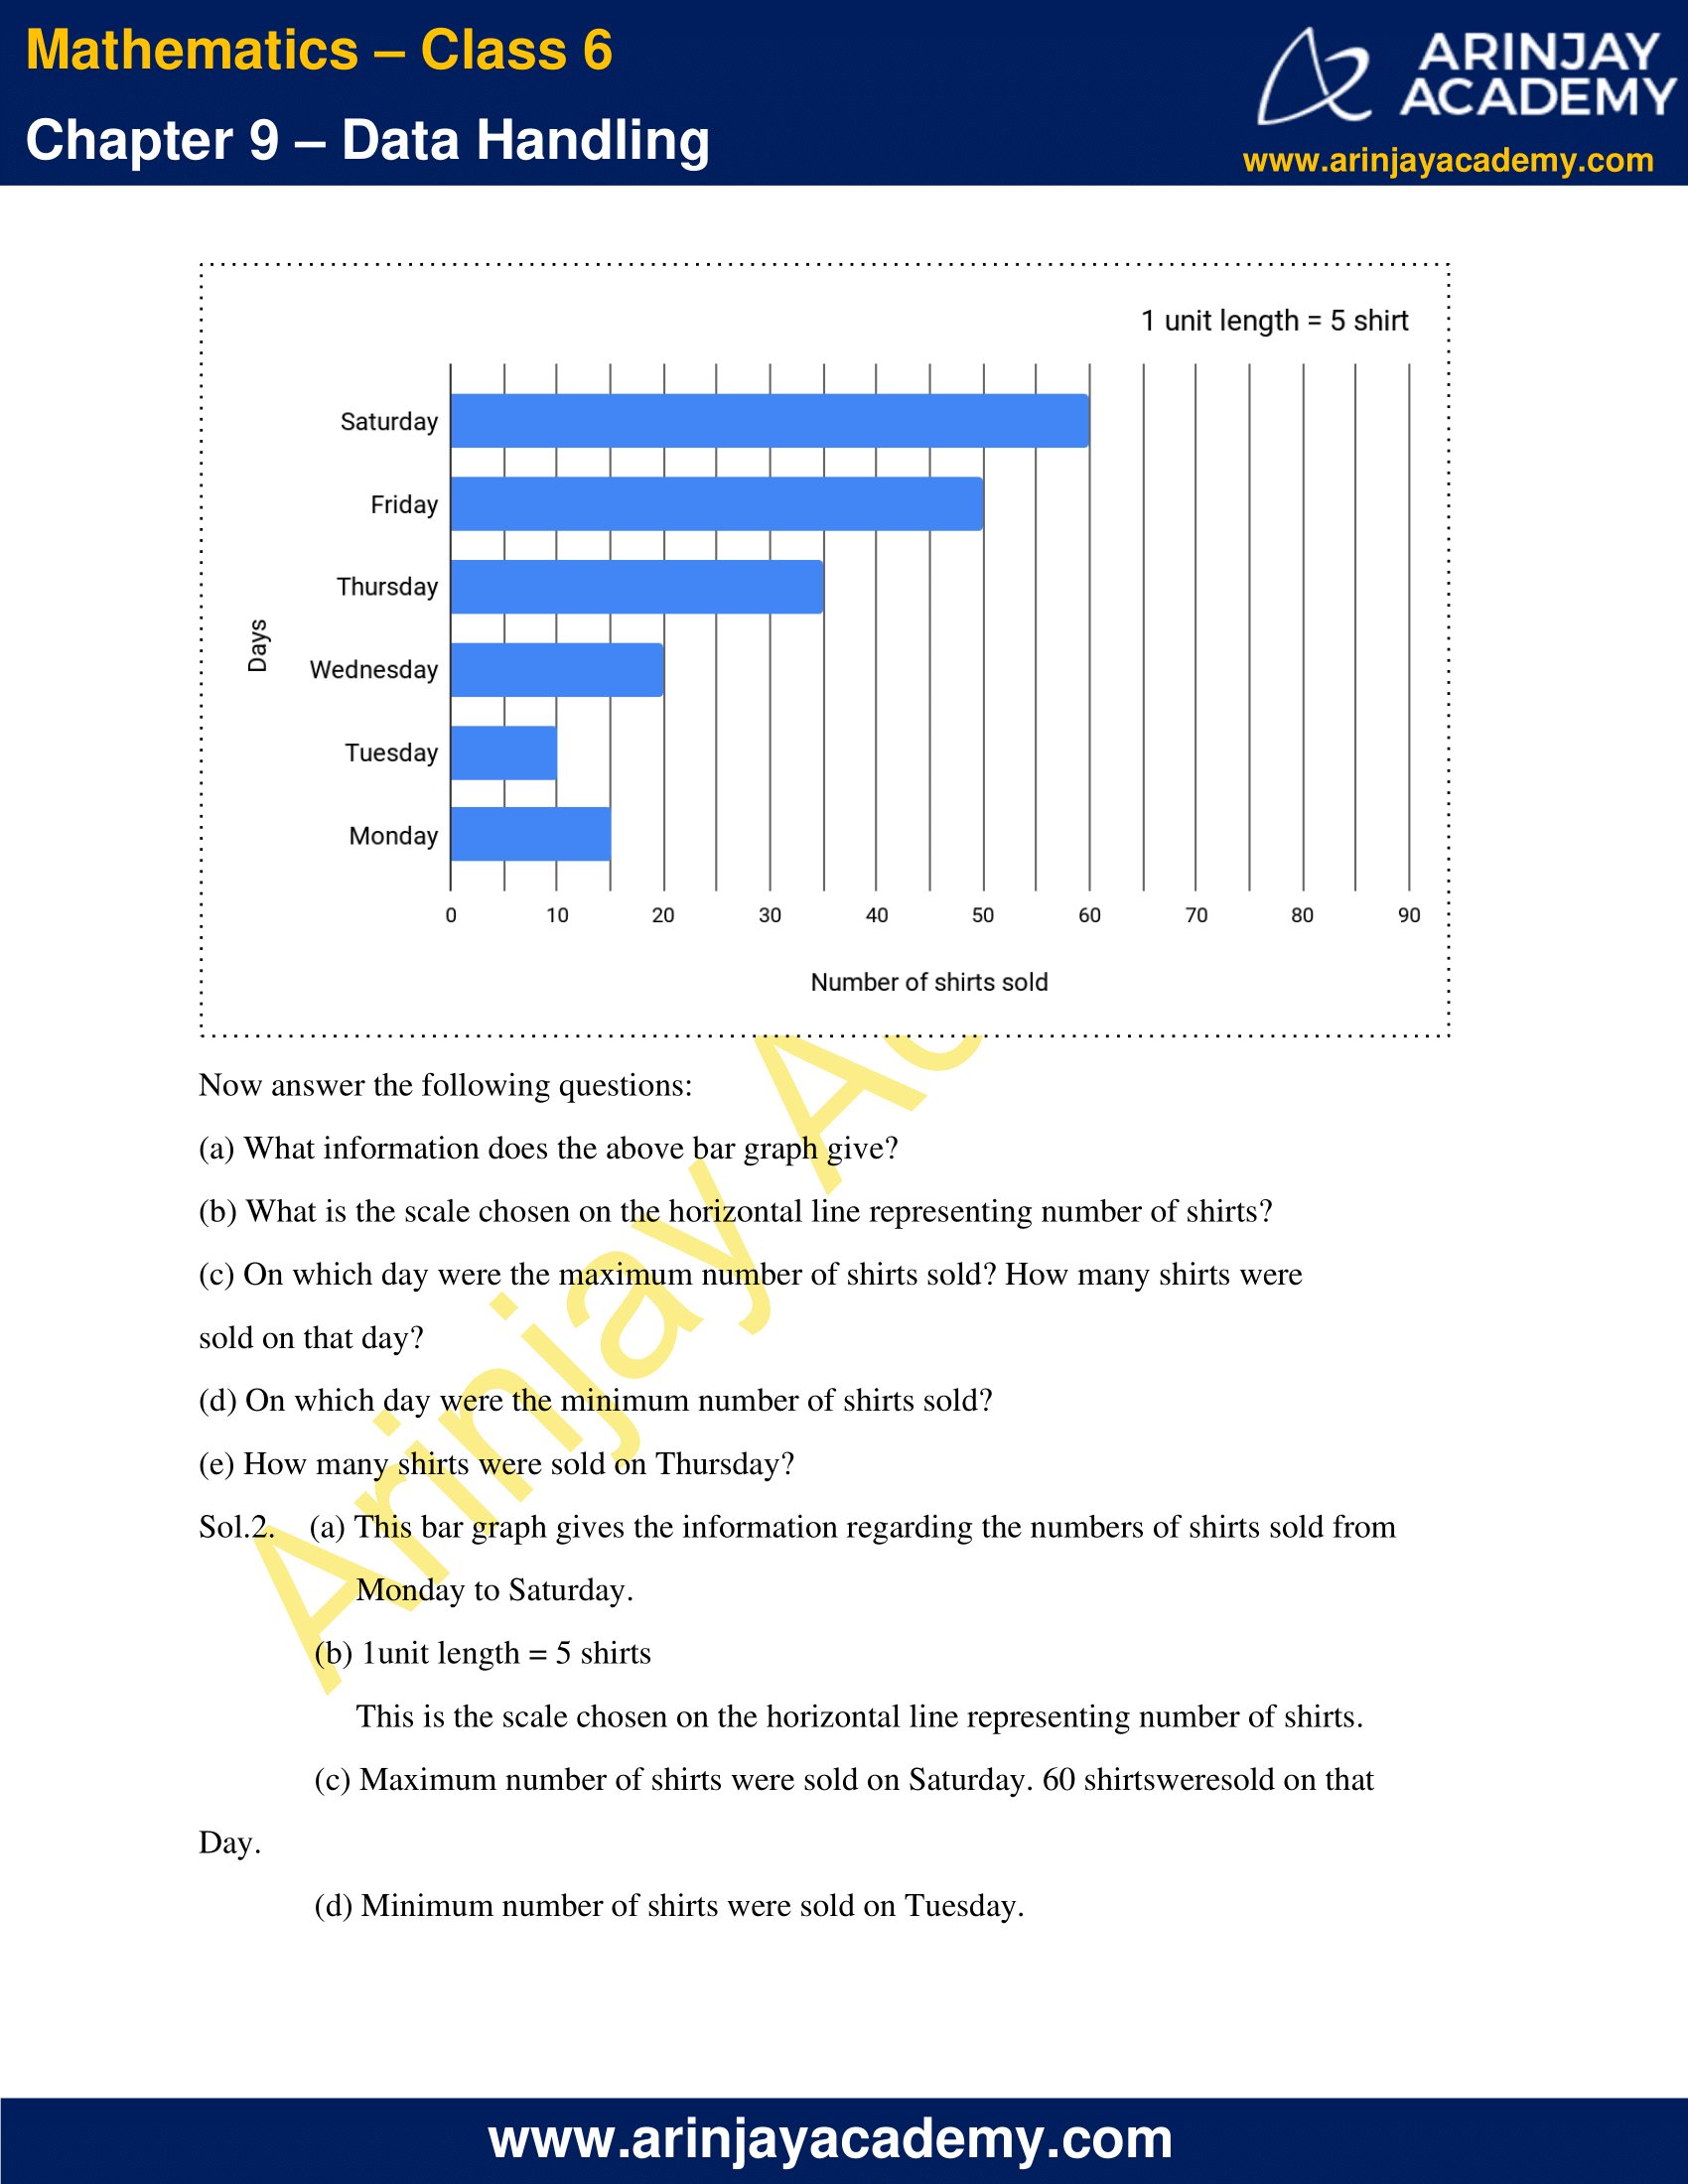
Ques. 2. Observe this bar graph which is showing the sale of shirts in a readymade shop from Monday to Saturday.
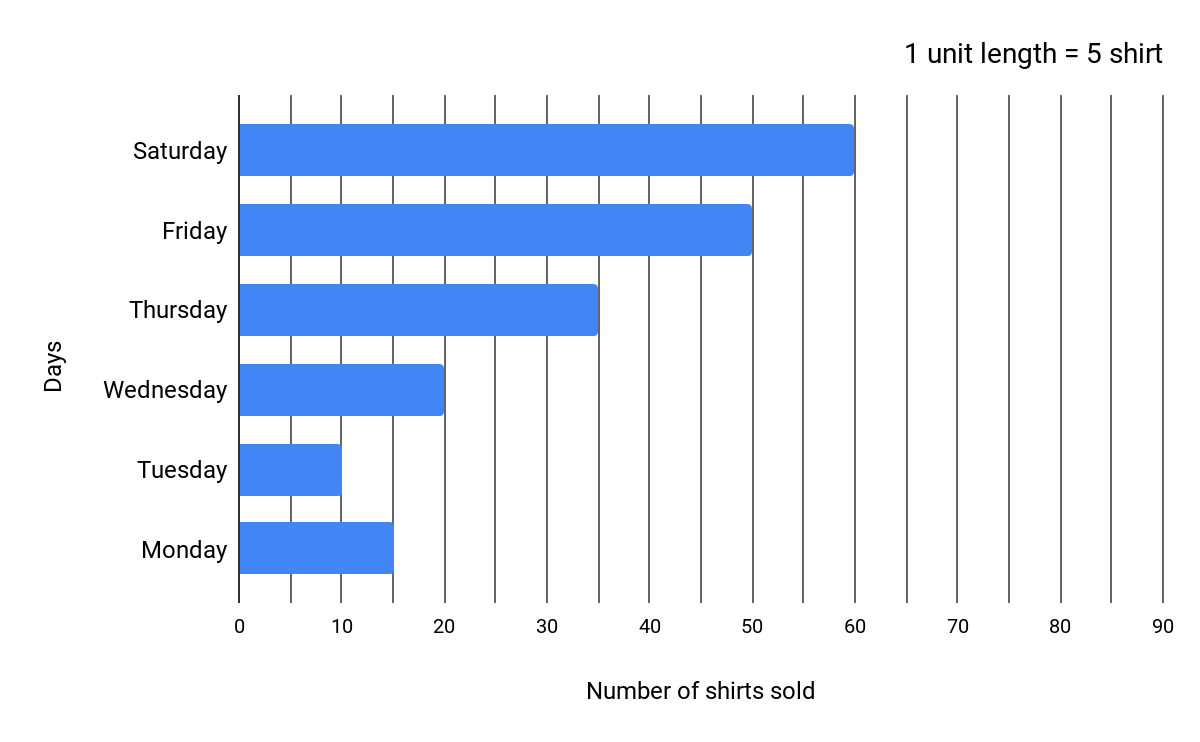
Now answer the following questions:
(a) What information does the above bar graph give?
(b) What is the scale chosen on the horizontal line representing number of shirts?
(c) On which day were the maximum number of shirts sold? How many shirts were sold on that day?
(d) On which day were the minimum number of shirts sold?
(e) How many shirts were sold on Thursday?
Sol.2. (a) This bar graph gives the information regarding the numbers of shirts sold from
Monday to Saturday.
(b) 1unit length = 5 shirts
This is the scale chosen on the horizontal line representing number of shirts.
(c) Maximum number of shirts were sold on Saturday. 60 shirts were sold on that Day.
(d) Minimum number of shirts were sold on Tuesday.
(e) 35 shirts were sold on Thursday.
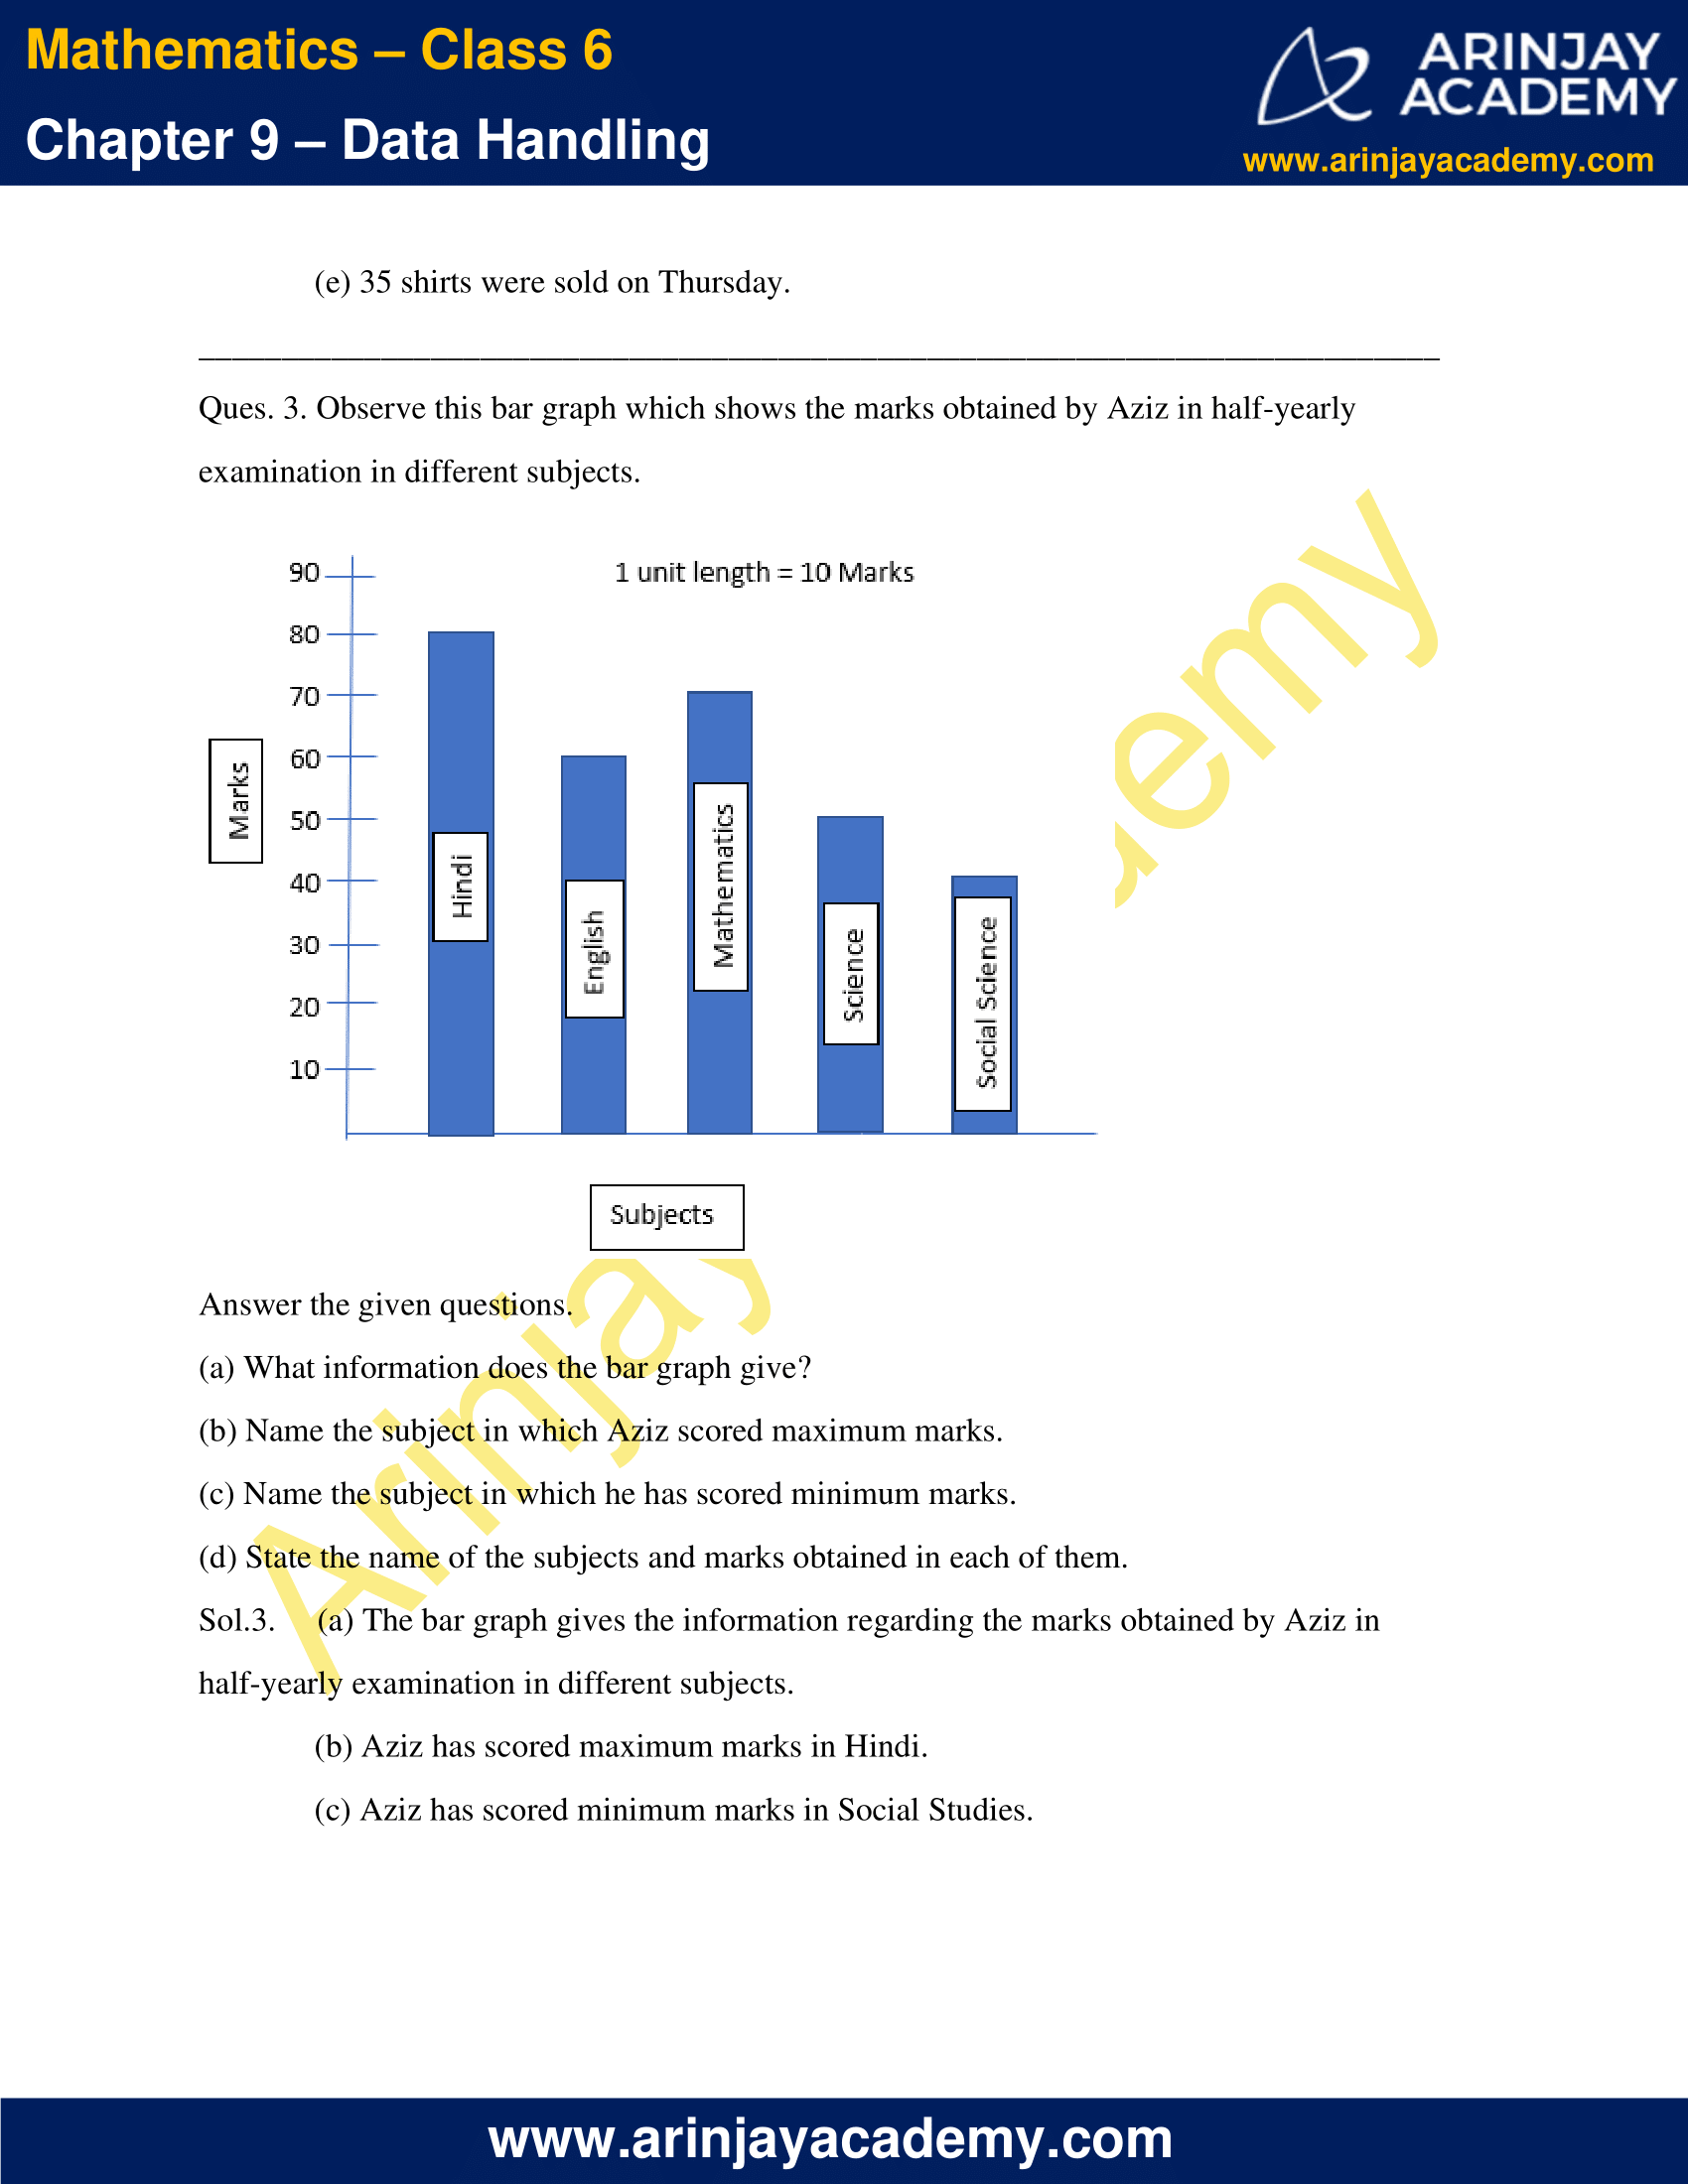
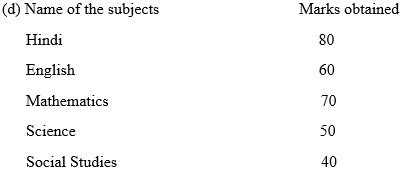
Ques. 3. Observe this bar graph which shows the marks obtained by Aziz in half-yearly examination in different subjects.
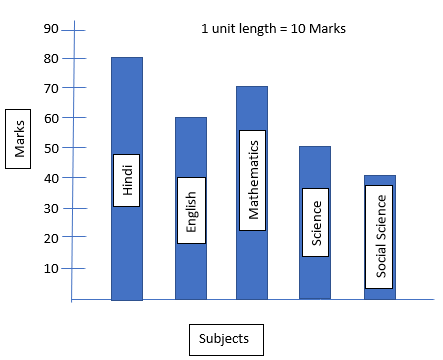
Answer the given questions.
(a) What information does the bar graph give?
(b) Name the subject in which Aziz scored maximum marks.
(c) Name the subject in which he has scored minimum marks.
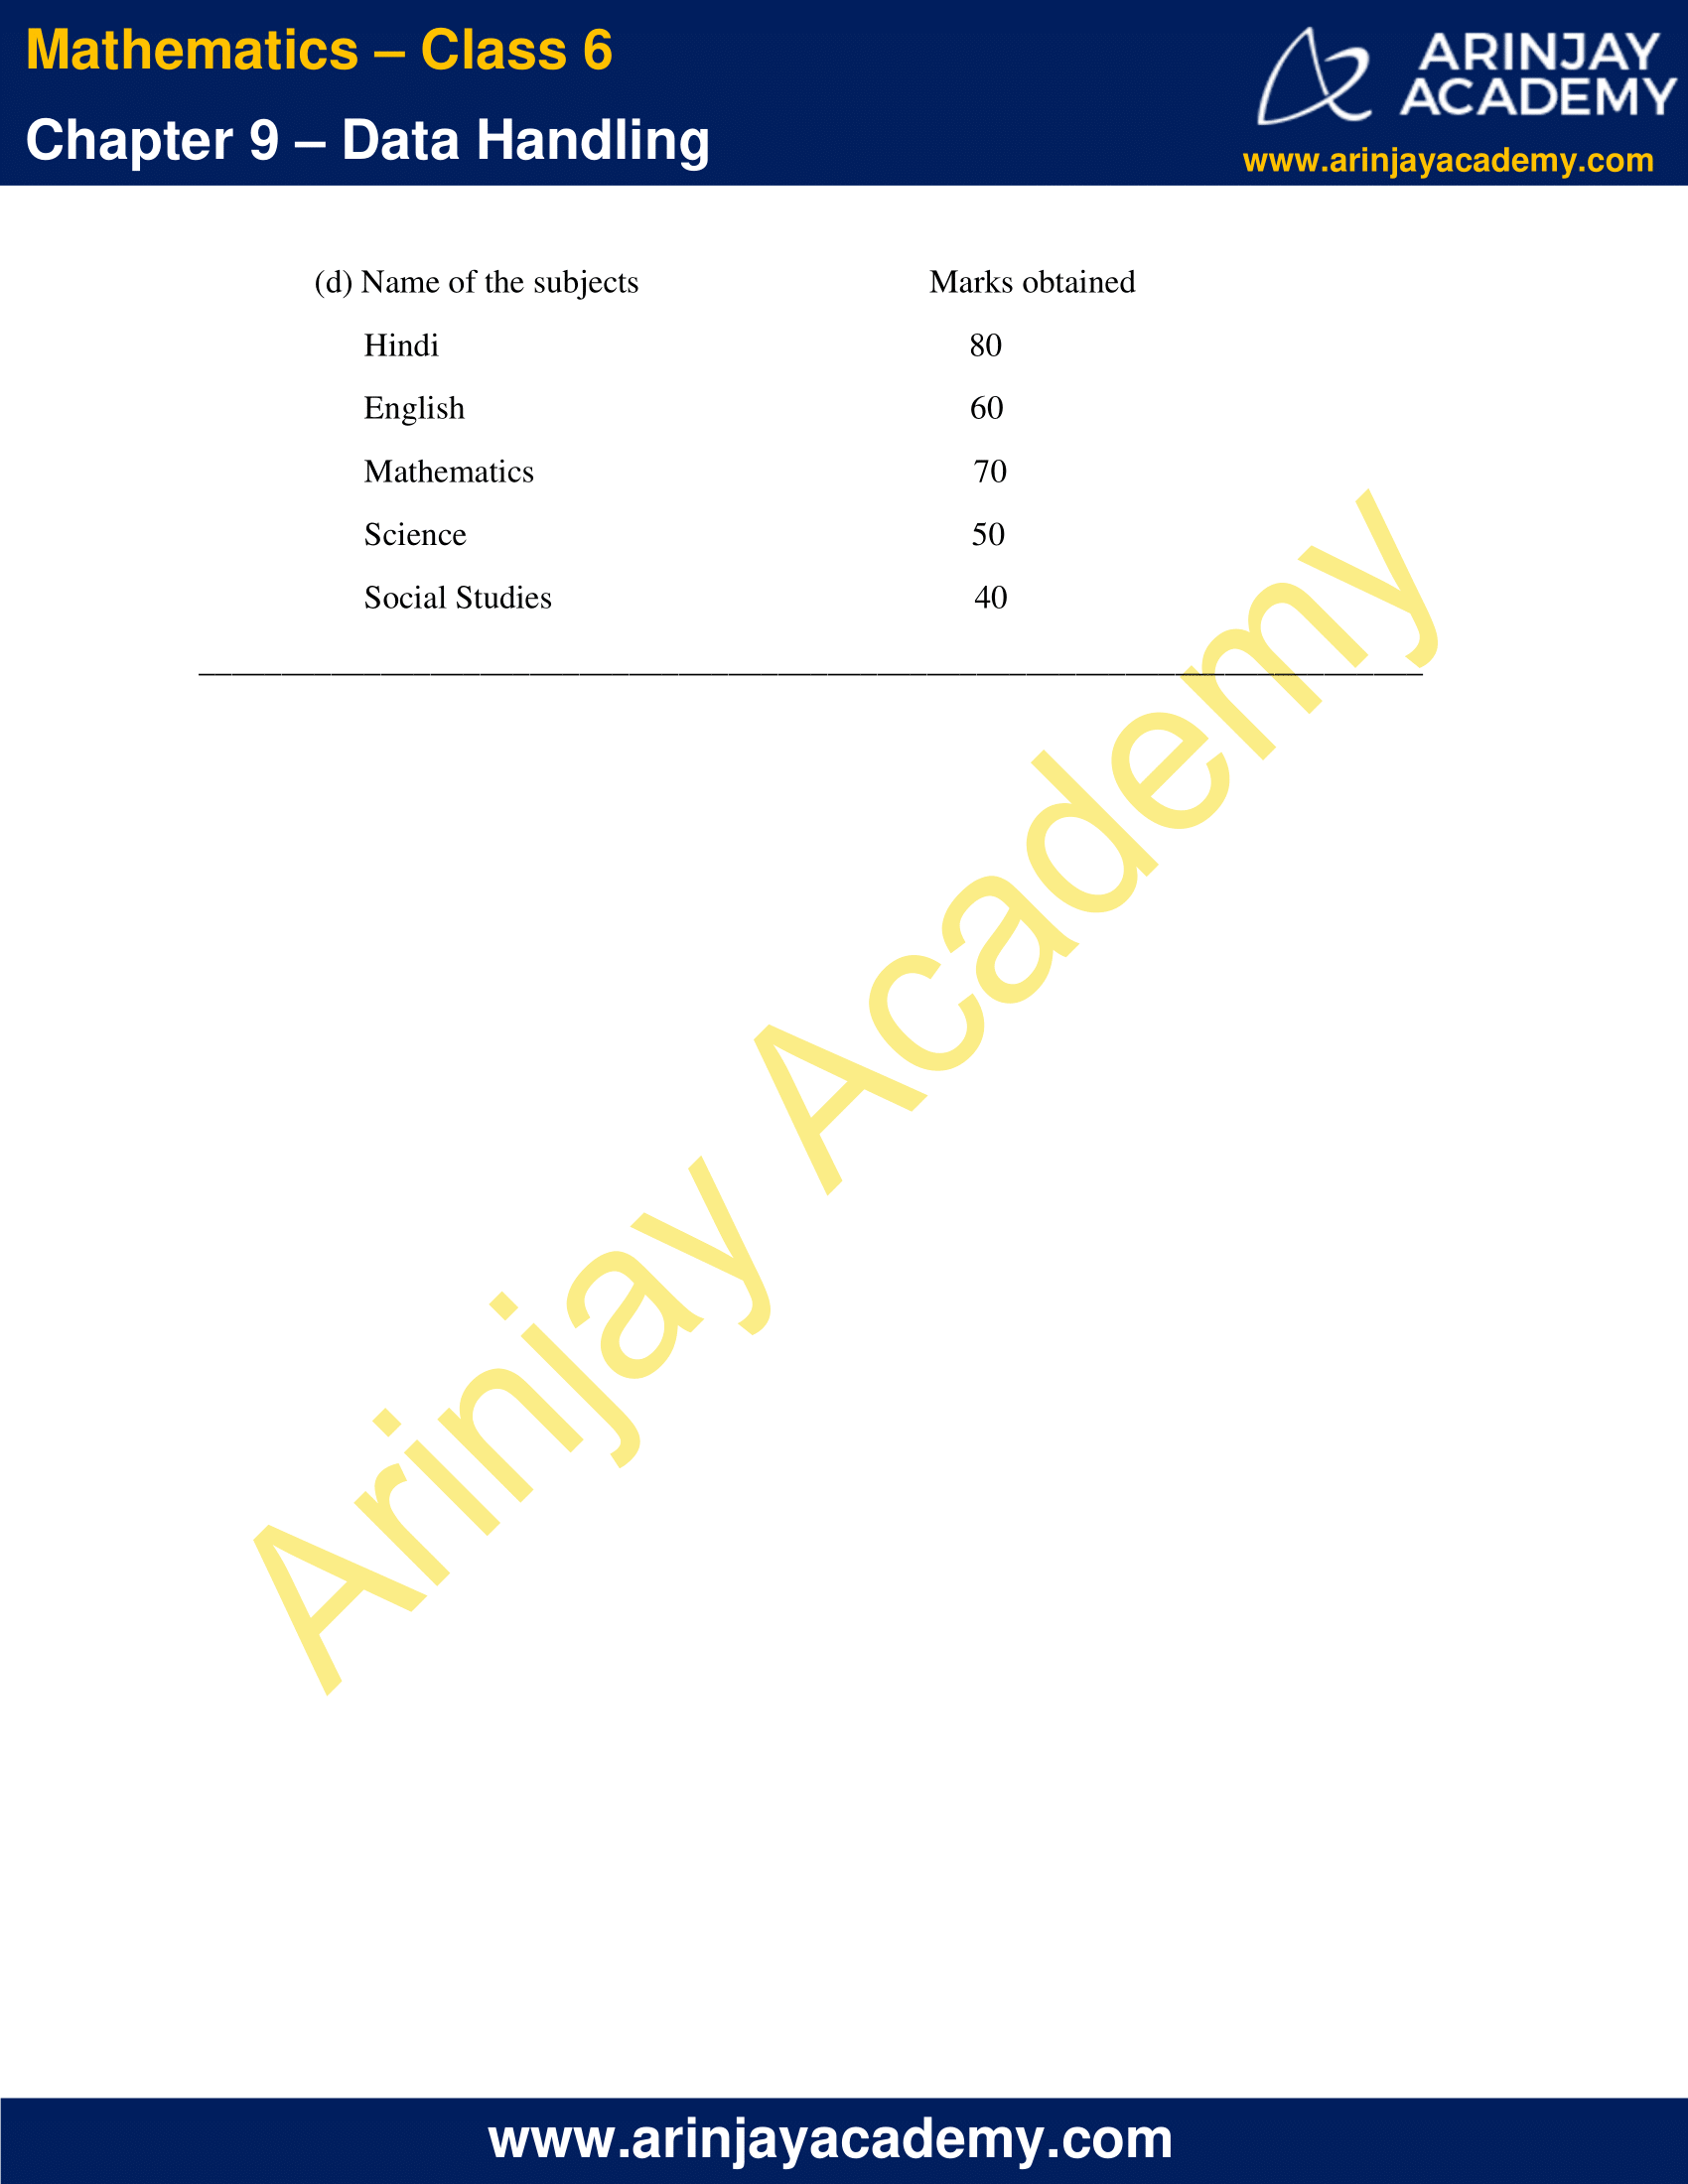
(d) State the name of the subjects and marks obtained in each of them.
Sol.3. (a) The bar graph gives the information regarding the marks obtained by Aziz in half-yearly examination in different subjects.
(b) Aziz has scored maximum marks in Hindi.
(c) Aziz has scored minimum marks in Social Studies.
NCERT Solutions for Class 6 Maths Chapter 9 Exercise 9.4
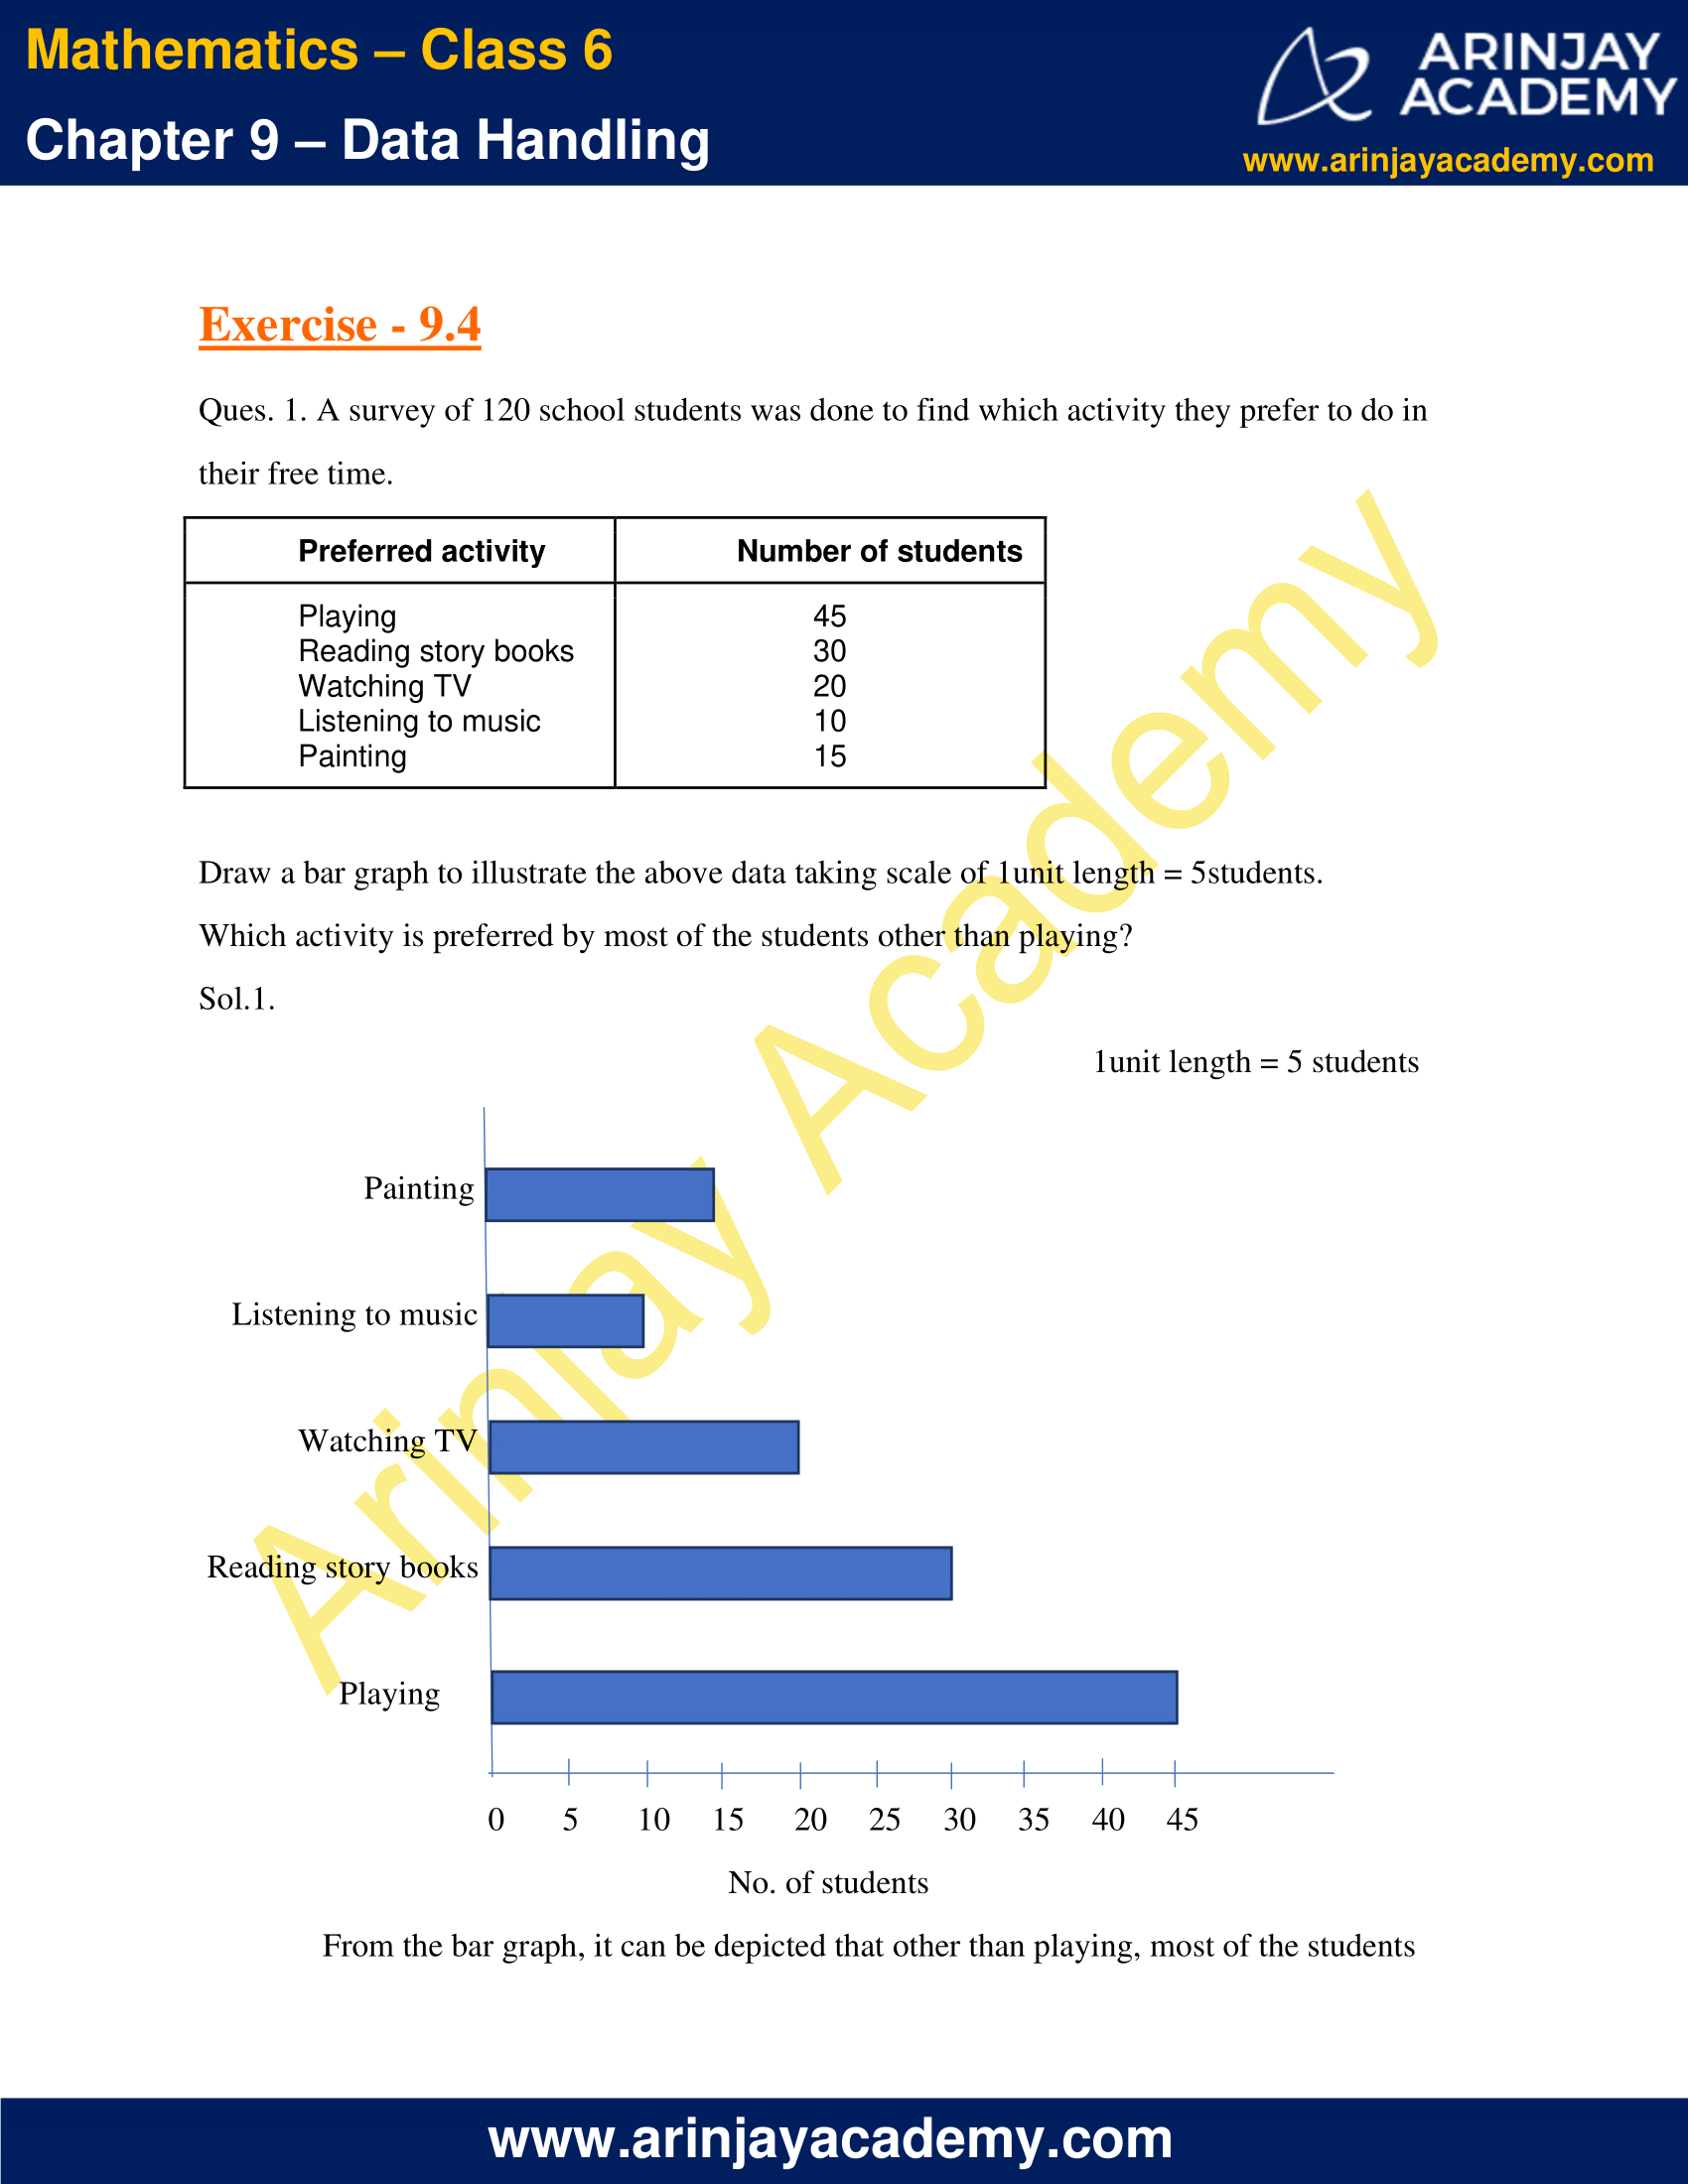
Ques. 1. A survey of 120 school students was done to find which activity they prefer to do in their free time.
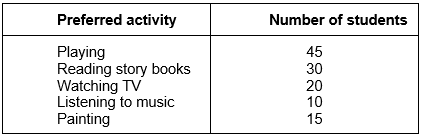
Draw a bar graph to illustrate the above data taking scale of 1 unit length = 5 students.
Which activity is preferred by most of the students other than playing?
Sol.1.
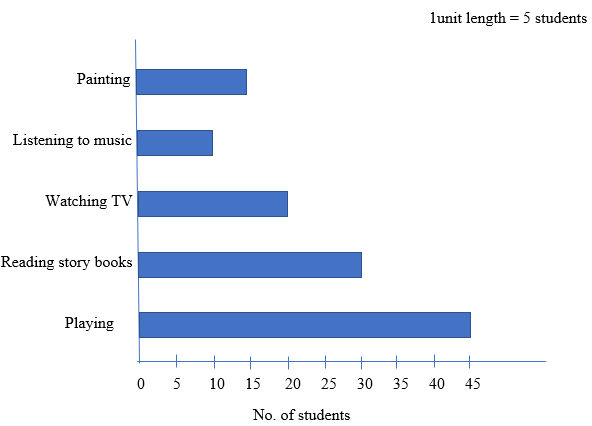
From the bar graph, it can be depicted that other than playing, most of the students prefer reading story books.
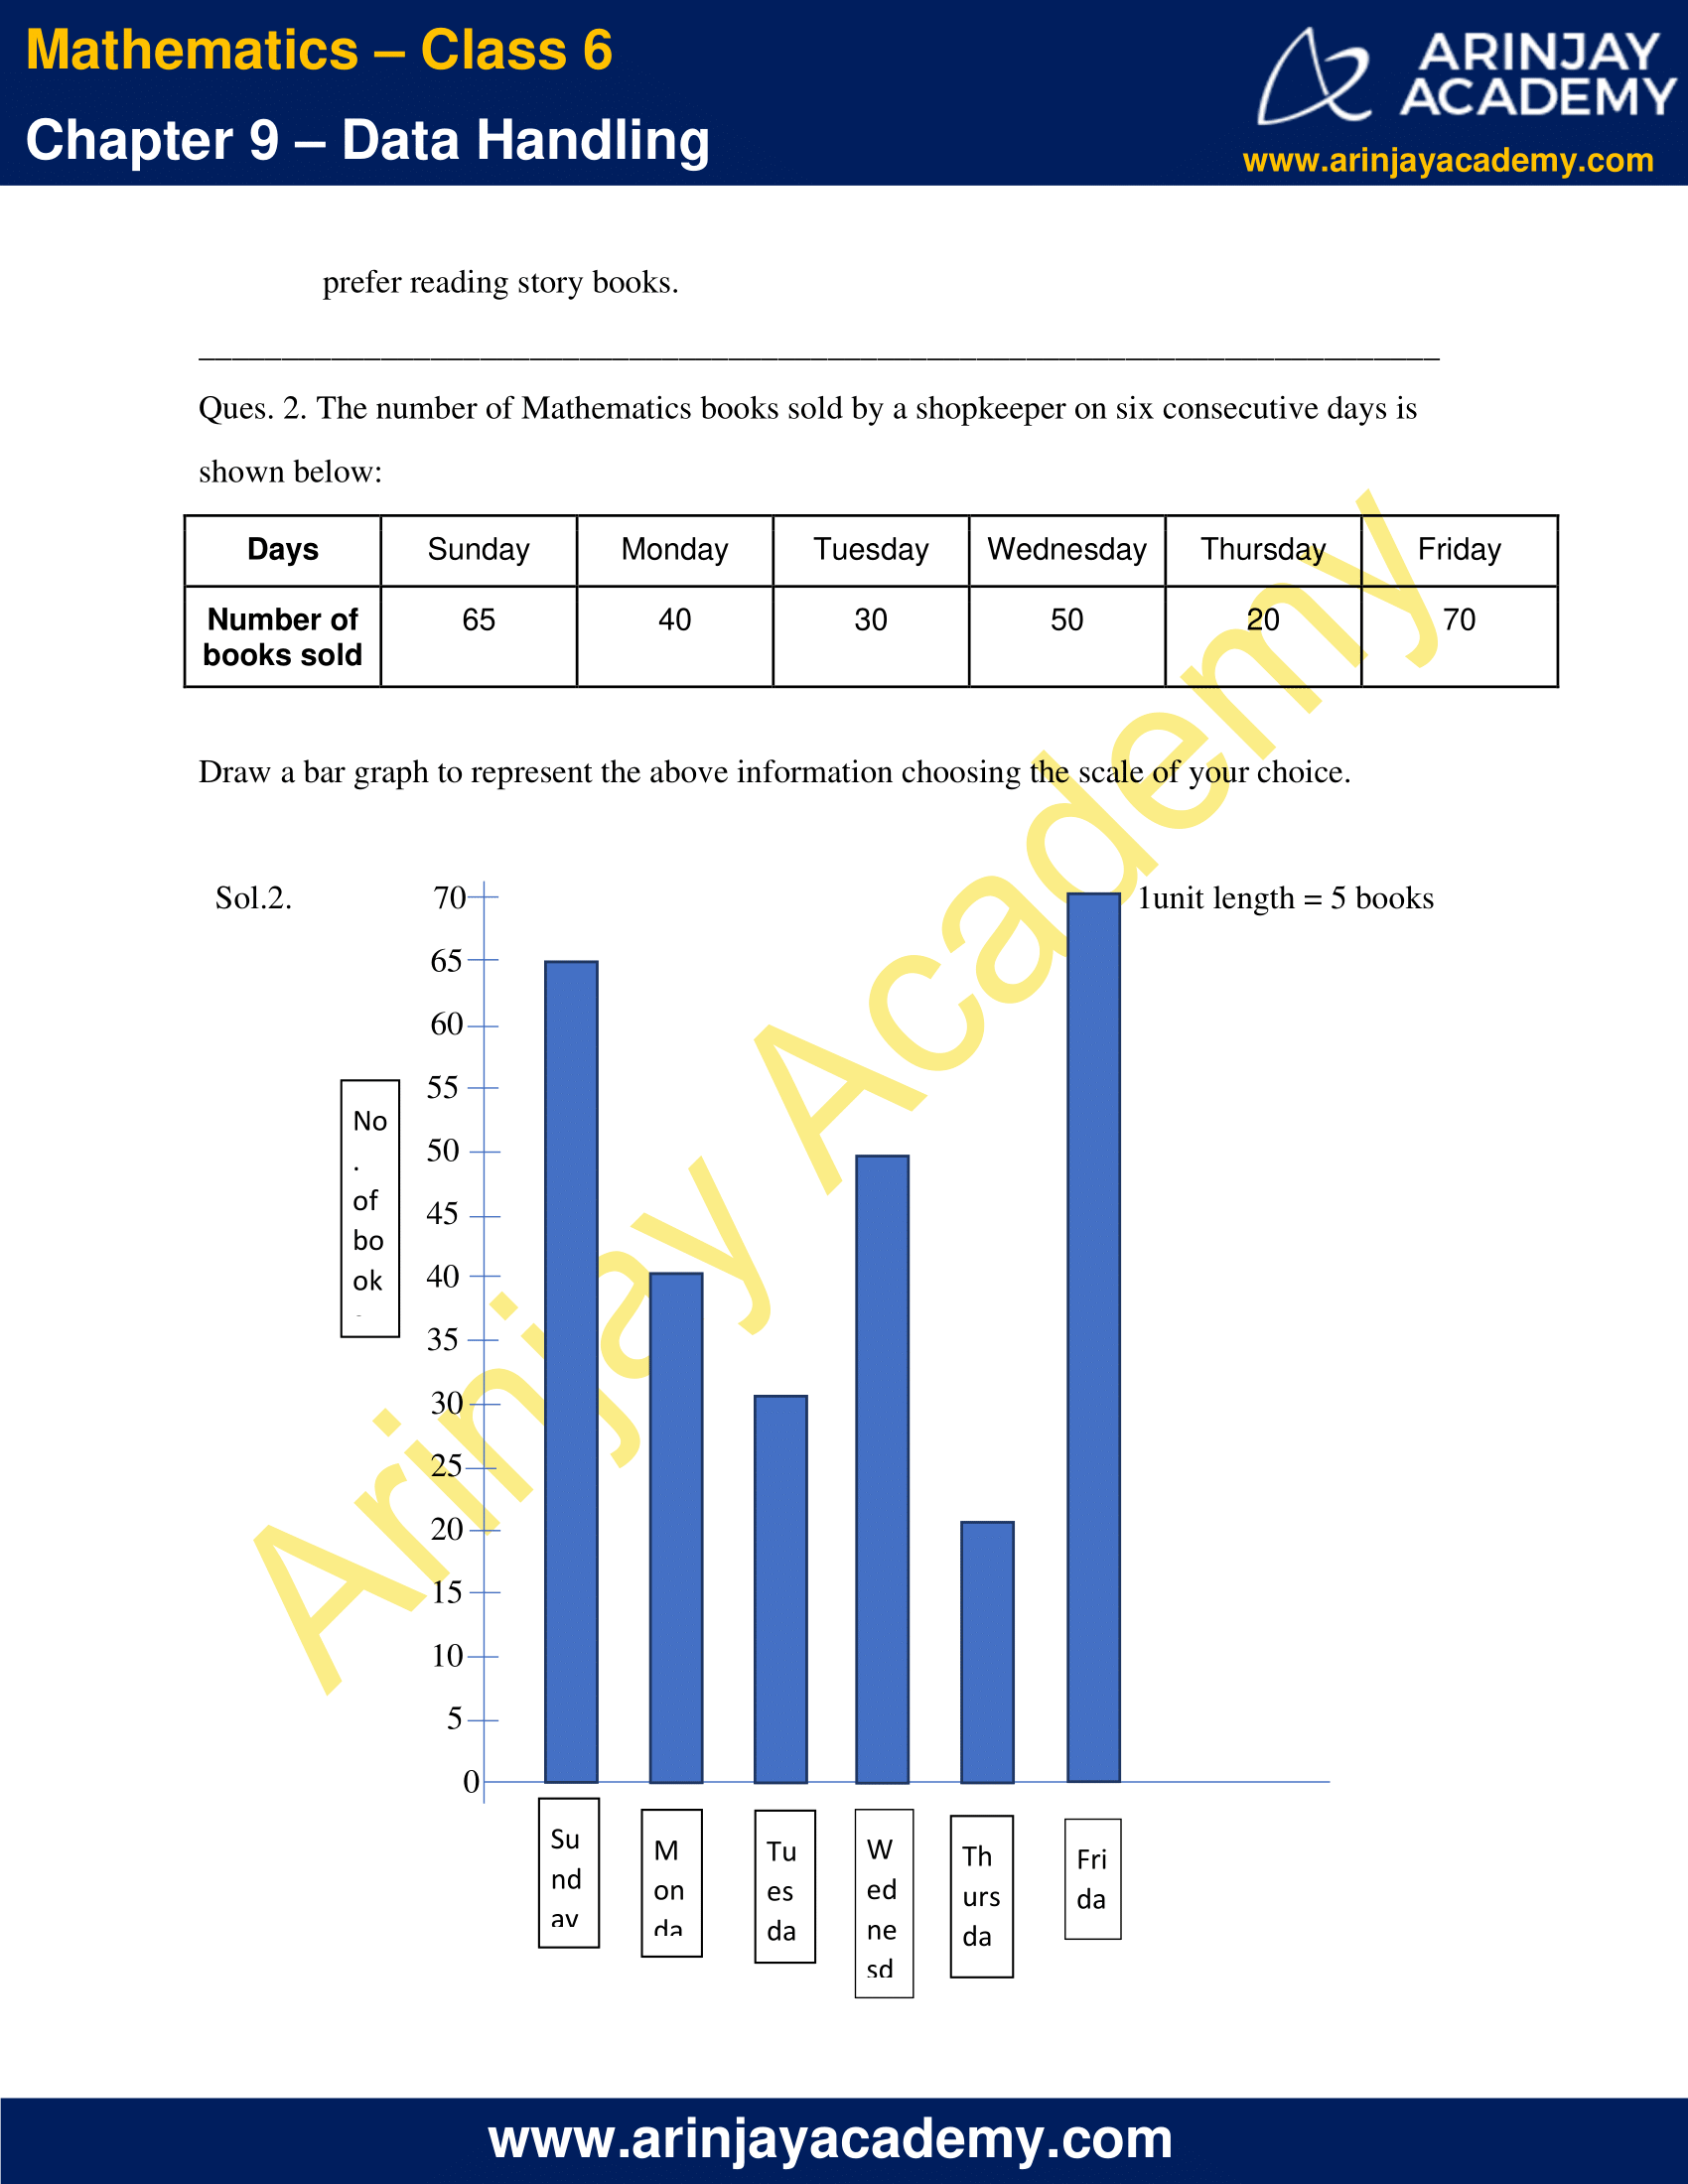
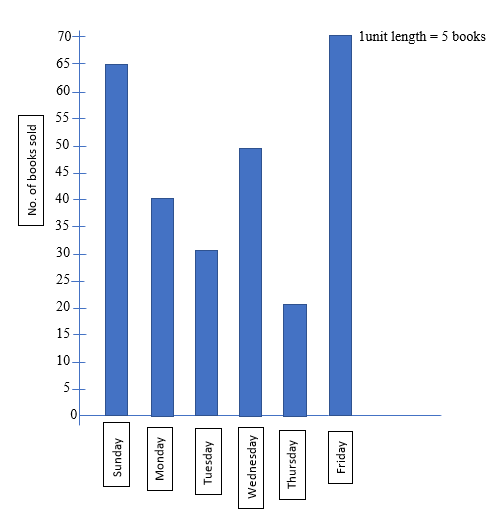
Ques. 2. The number of Mathematics books sold by a shopkeeper on six consecutive days is shown below:
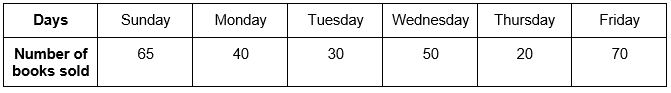
Draw a bar graph to represent the above information choosing the scale of your choice.
Sol.2.
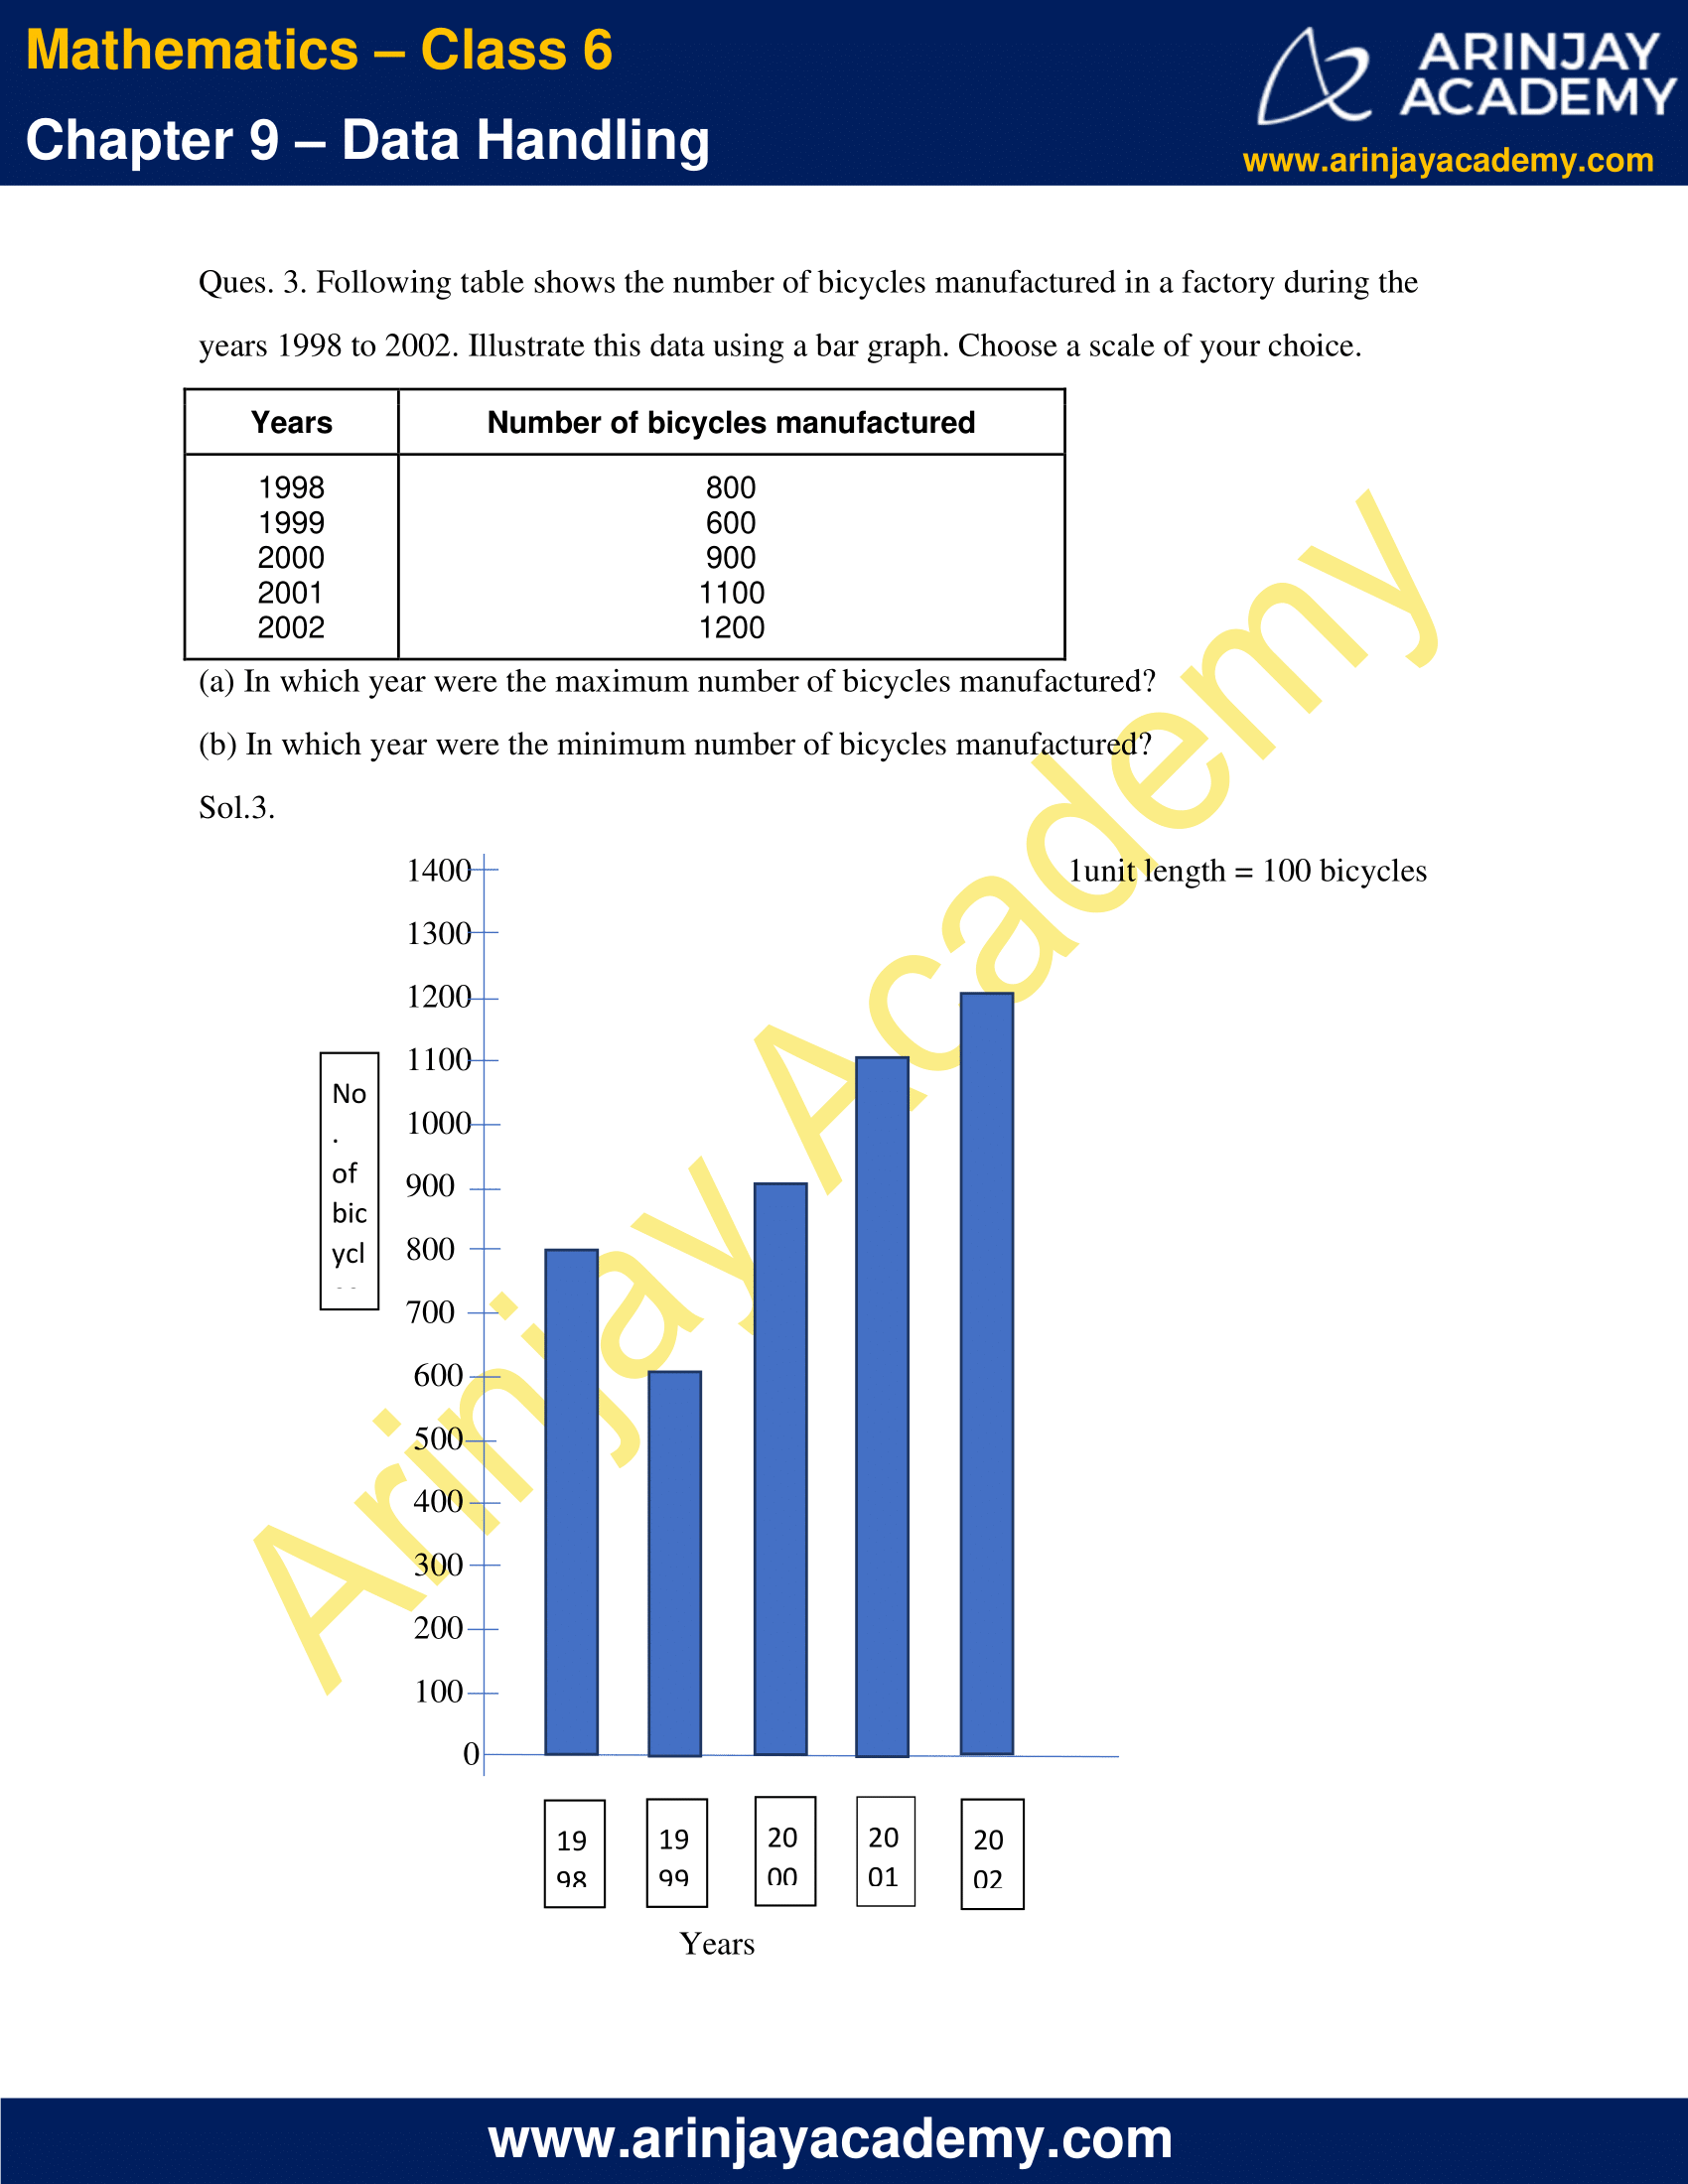
Ques. 3. Following table shows the number of bicycles manufactured in a factory during the years 1998 to 2002. Illustrate this data using a bar graph. Choose a scale of your choice.
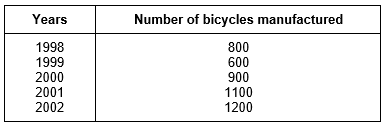
(a) In which year were the maximum number of bicycles manufactured?
(b) In which year were the minimum number of bicycles manufactured?
Sol.3.
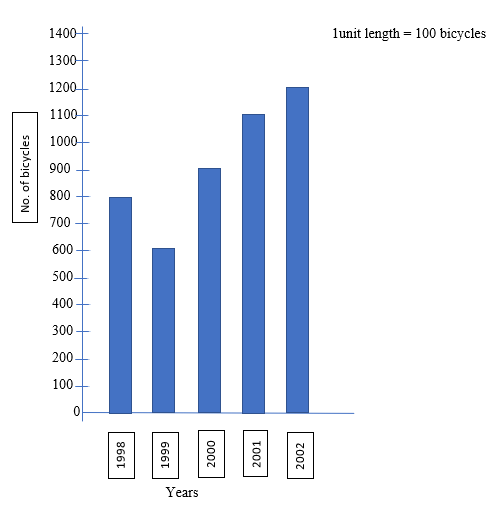
(a) The maximum number of bicycles were manufactured in the year 2002.
(b) The minimum number of bicycles were manufactured in the year 1999.
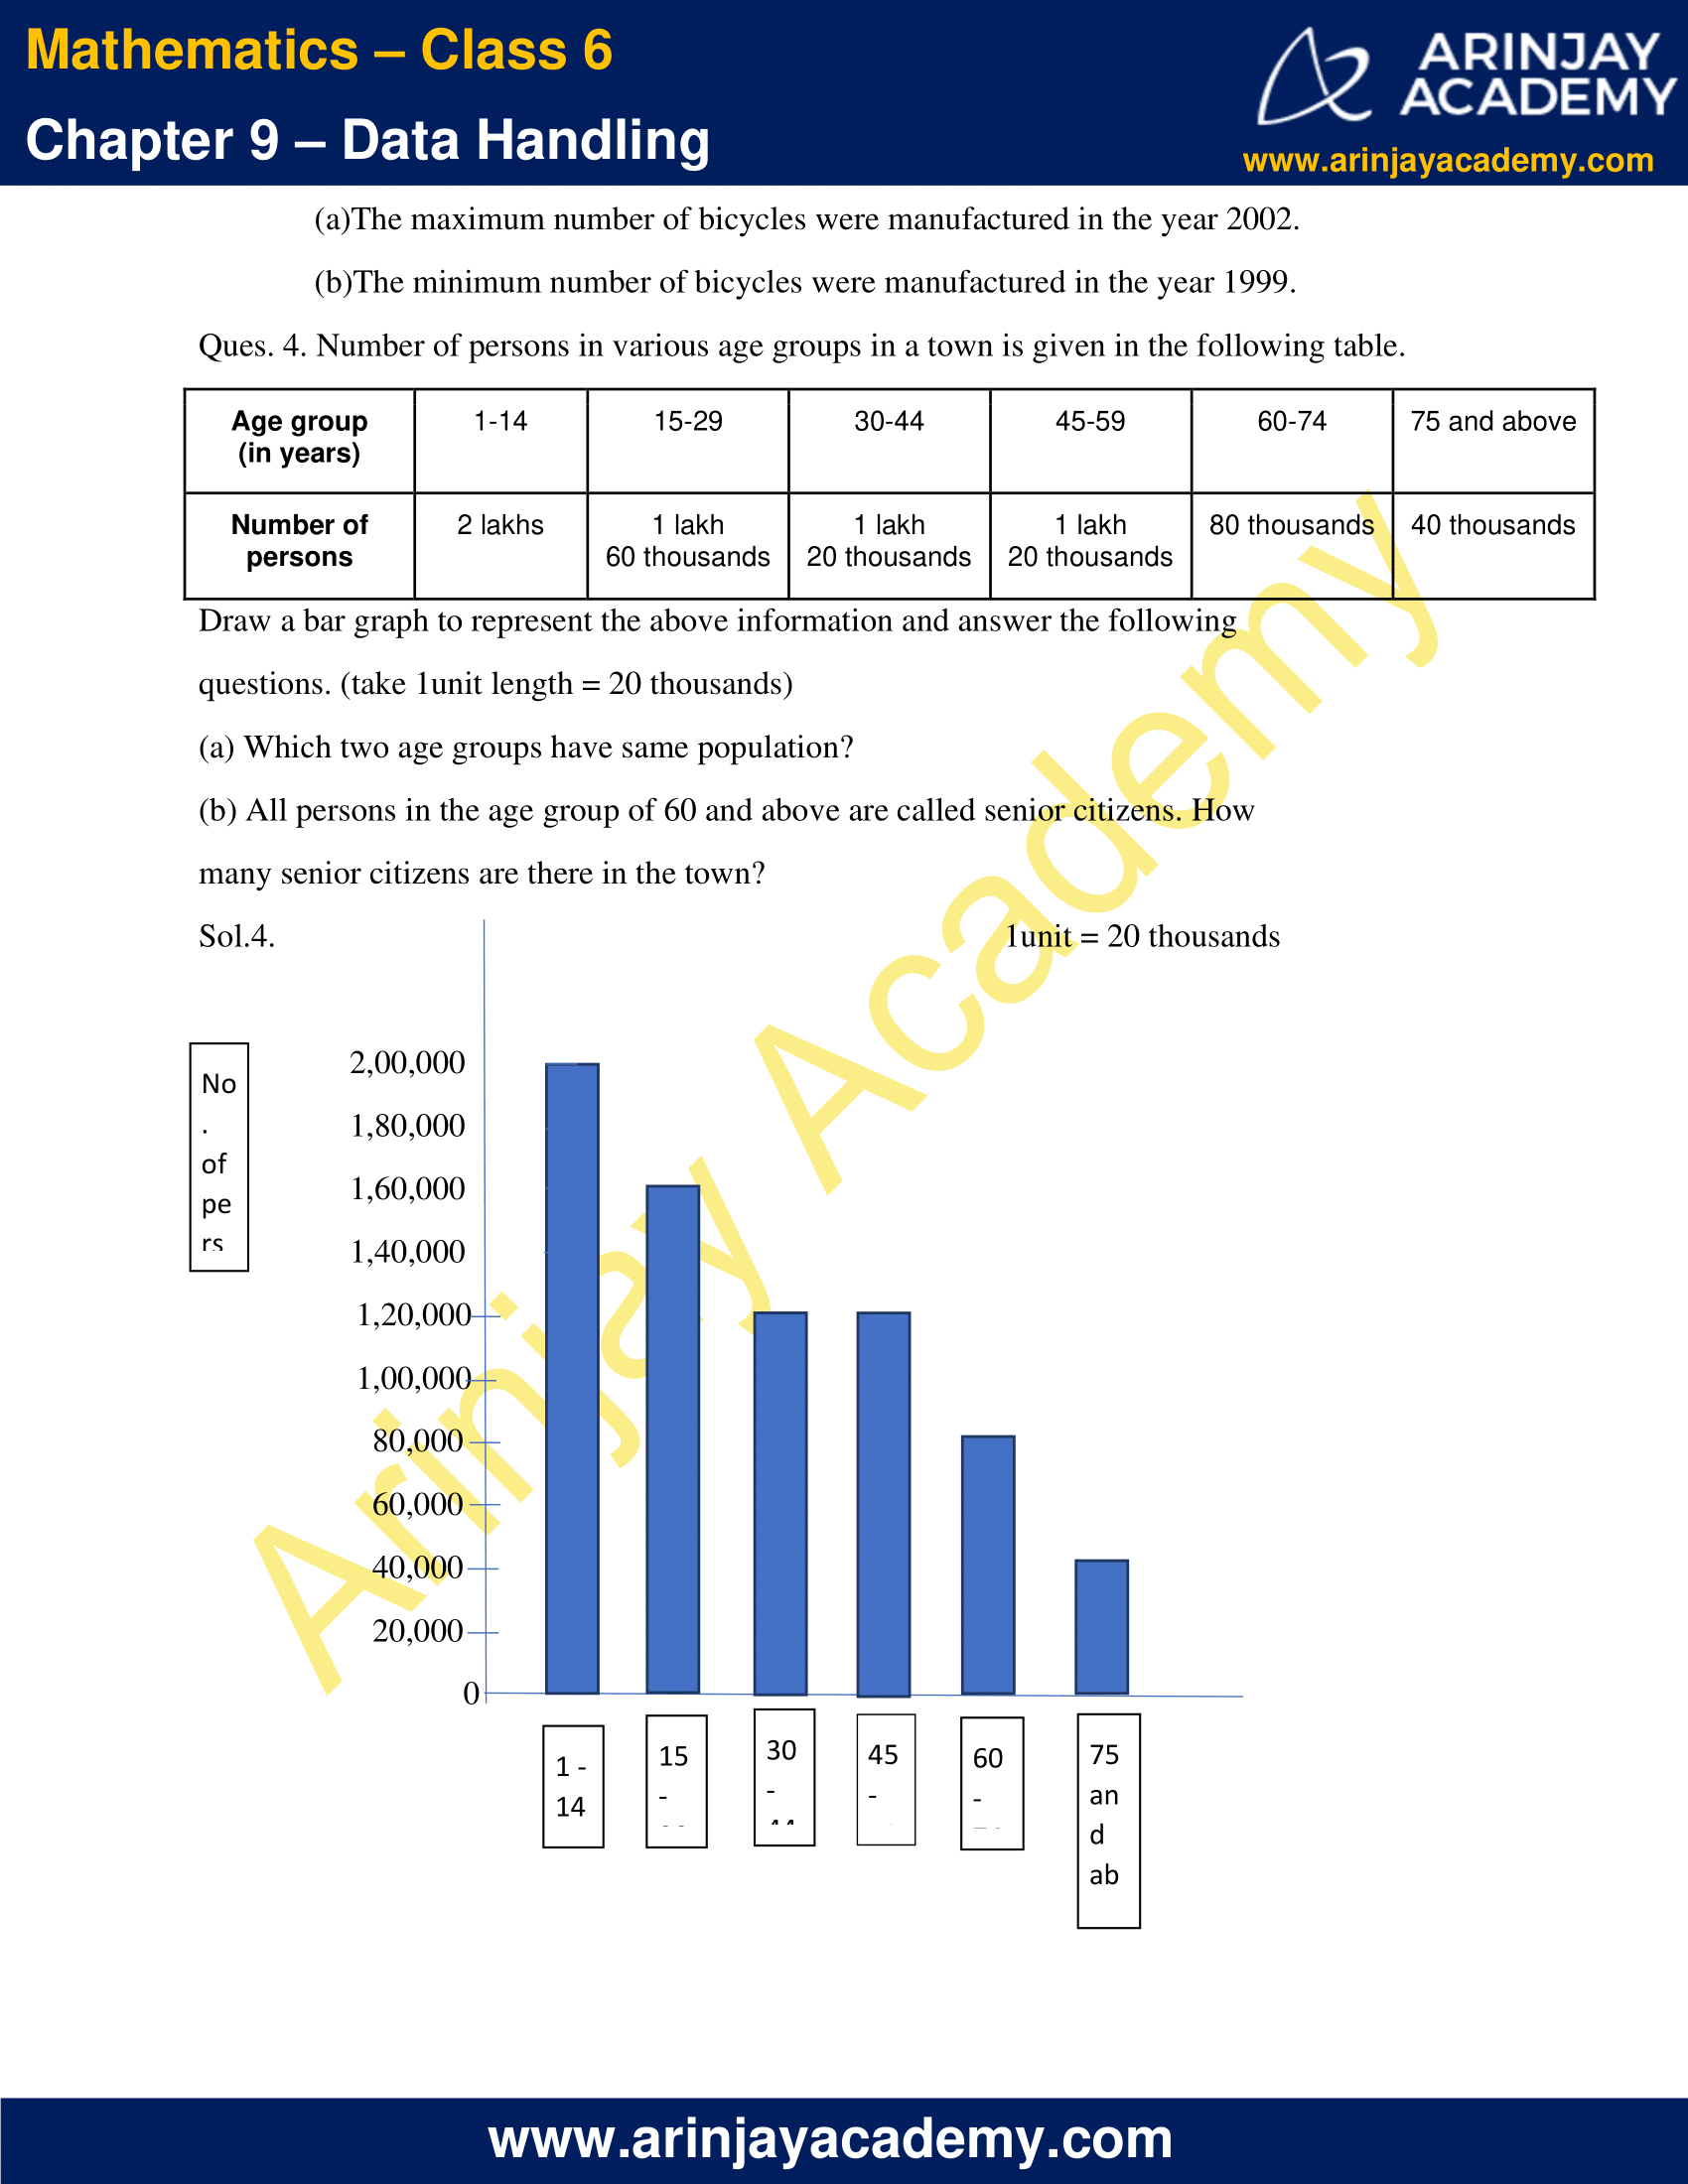
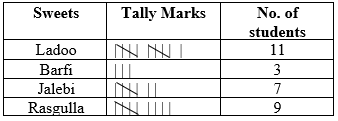
Ques. 4. Number of persons in various age groups in a town is given in the following table.
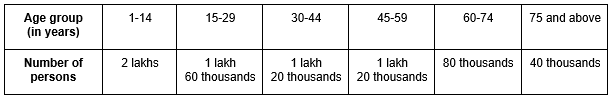
Draw a bar graph to represent the above information and answer the following questions. (take 1unit length = 20 thousands)
(a) Which two age groups have same population?
(b) All persons in the age group of 60 and above are called senior citizens. How many senior citizens are there in the town?
Sol.4.
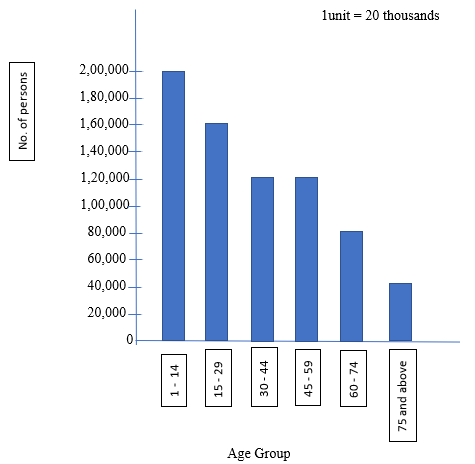
(a) Two age groups having same population are 30-44 and 45-59.
(b) No. of senior citizens in the town = 80,000 + 40,000
= 1,20,000
With this we come to the end of NCERT Solutions for Class 6 Maths Chapter 9 Data Handling. We hope these helped you study your subject.