Comparative Balance Sheet
A comparative balance sheet presents side-by-side information about an entity’s assets, liabilities, and shareholder’s equity as of multiple points in time. It shows increases and decreases in the various assets, liabilities, and capital. A comparative balance sheet usually has two columns of amounts that appear to the right of the descriptions. The first column of amounts contains the amounts as of a recent moment or point of time i.e. current year and the column to the right contains corresponding amounts from a previous year.
Advantages of a comparative balance sheet are:
- The emphasis of the comparative balance sheet is on change.
- It acts as a connection between Statement of Profit and Loss and Balance Sheet.
- A comparative balance sheet is helpful in comparison to a single year’s balance sheet.
Comparative Balance Sheet Example
Comparative Balance Sheet: Example 1
Following is the information provided by A LTD
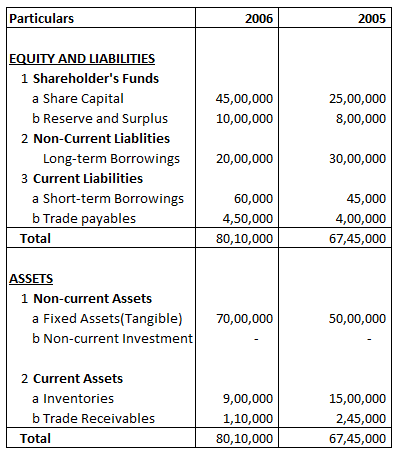
Absolute Change and Percentage Change in share capital is
Explanation: –
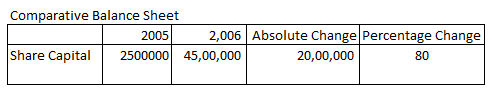
Absolute Change = Current year’s figure – Previous year’s figure
= 4500000 – 2500000
= 2000000
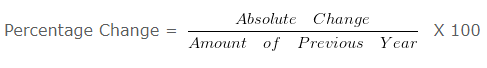
= 2000000/2500000 X 100
= 80 %
Comparative Balance Sheet: Example 2
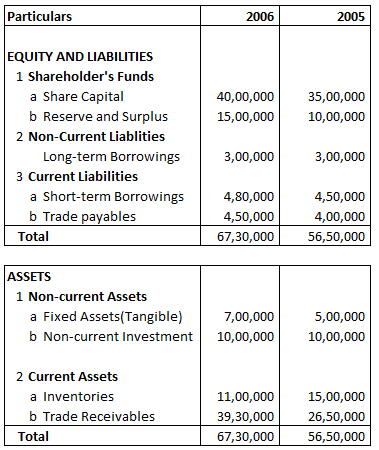
Following is the Balance sheet of AA Ltd
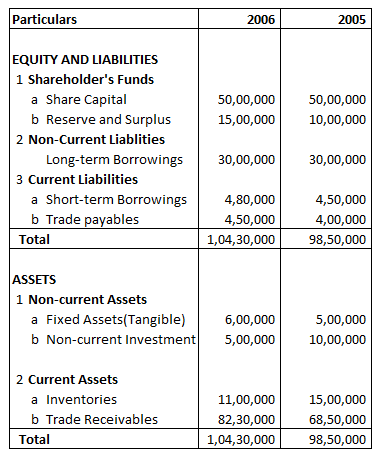
Absolute Change and Percentage Change in Reserve and Surplus is:
Explanation: –
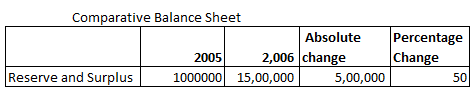
Absolute change = Current year’s figure – Previous year’s figure
= 1500000 – 1000000
= 500000
= 500000/1000000 X 100
= 50
Comparative Balance Sheet: Example 3
Following is the Balance sheet of B Ltd
Absolute Change and Percentage Change in Long-term Borrowings is:
Explanation: –
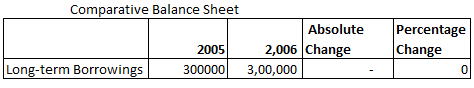
Absolute Change = Current year’s figure – Previous year’s figure
= 300000 – 300000
= 0
= 0/300000 X 100
= 0
Comparative Balance Sheet: Example 4
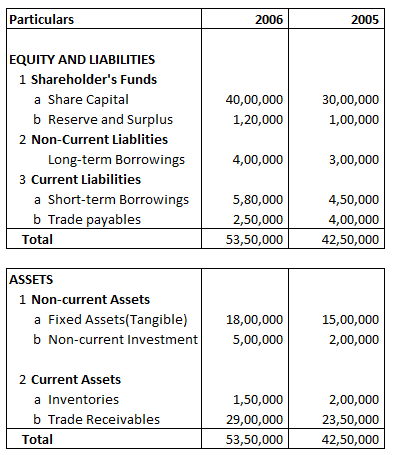
Following is the Balance sheet of A Ltd
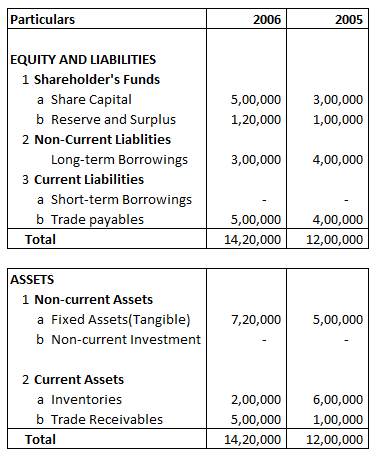
Absolute Change and Percentage Change in Trade payable is:
Explanation: –
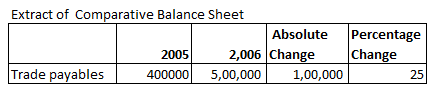
Absolute Change = Current year’s figure – Previous year’s figure
= 500000 – 400000
= 100000
= 100000/400000 X 100
= 25
Comparative Balance Sheet: Example 5
Following is the Balance sheet of A Ltd
Absolute Change and Percentage Change in Fixed Assets(Tangible) is:
Explanation: –
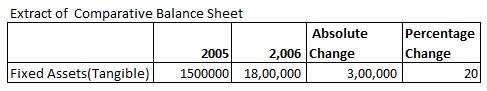
Absolute Change = Current year’s figure – Previous year’s figure
= 1800000 – 1500000
= 300000
= 300000/1500000 X 100
= 20
Example 6
Following is the Balance Sheet of AX Ltd
Share Capital Percentage of Balance Sheet total for 2005 will be:
Explanation: –
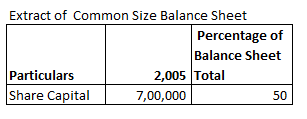
Share Capital Percentage of Balance Sheet Total 2005 =
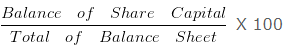
= 700000/1400000 X 100
= 50
Comparative Balance Sheet: Example 7
Following is the Balance Sheet of A Ltd
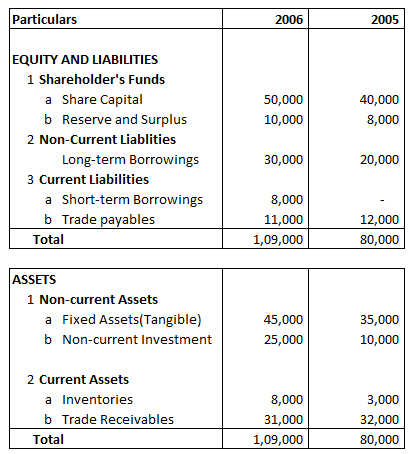
Reserve and Surplus Percentage of Balance Sheet total for 2005 will be:
Explanation: –
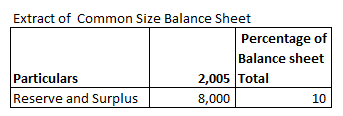
Reserve and Surplus Percentage of Balance Sheet Total 2005 = 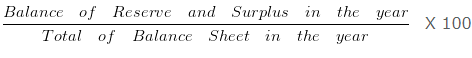
= 8000/80000 X 100
= 10
Comparative Balance Sheet: Example 8
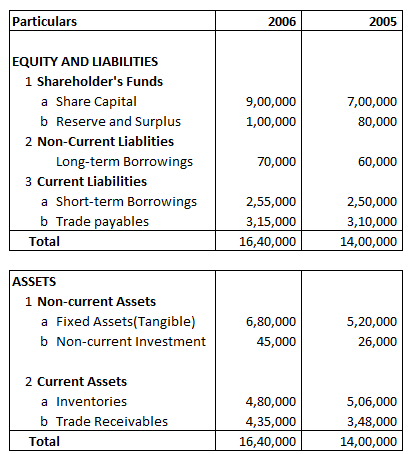
Following is the balance sheet of A Ltd
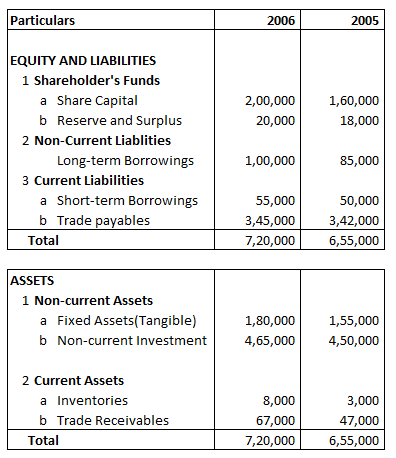
Fixed Assets(Tangible) Percentage of Balance Sheet Total for 2006 will be:
Explanation: –
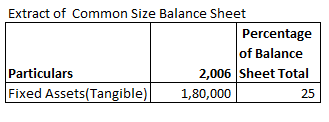
Fixed Assets(Tangible) Percentage of Balance Sheet Total 2006 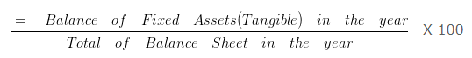
= 180000/720000 X 100
= 25
Example 9
Following is the Balance sheet of AB Ltd
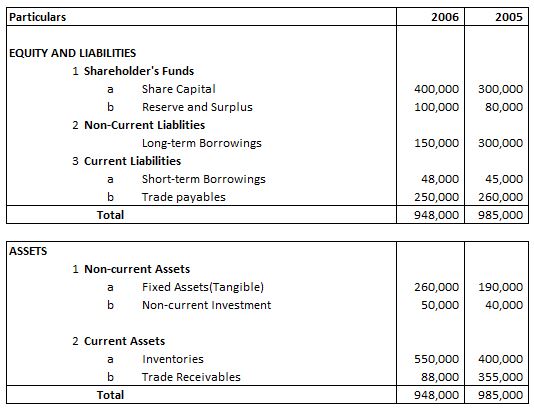
Absolute Change and Percentage Change in Inventories is:
Explanation: –
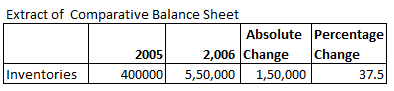
Absolute Change = Current year’s figure – Previous year’s figure
= 550000 – 400000
= 150000
= 150000/400000 X 100
= 37.5