Profitability
The profitability or financial performance is mostly summed up in the statement of profit and loss. Profitability ratios are determined to analyze the earning capacity of the business which is the result of the utilization of assets employed in the business. There is a close connection between the profit and the productivity with which the assets are utilized in the business are used.
The different ratios which are generally used to analyze the profitability of the business are:
- Gross Profit Ratio
- Operating Ratio
- Net Profit Ratio
- Operating Profit Ratio
- Earning Per Share
- Return on Investment (ROI) or Return on Capital Employed (ROCE)
- Return on Shareholders’ Funds
- Book Value per Share
- Dividend Payout Ratio
- Price / Earnings Ratio:
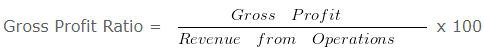
Profitability Ratios – Gross Profit Ratio
This ratio establishes a relationship between Gross profit and revenue from Operations i.e. Net Sales.
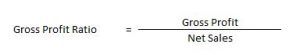
Gross Profit = Revenue from Operations – Cost of Revenue from Operations
Cost of Revenue from Operations = Opening Inventory + Purchases + Carriage Inward + Wages + Other Direct Charges – Closing Inventory
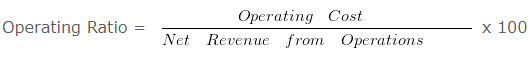
Profitability Ratios – Operating Ratio
This ratio compares an enterprise’s cost of revenue from operations and operating expenses to its revenue from operations.

Cost of Revenue from Operations = Opening Inventory + Purchases + Carriage Inward + Wages + Other Direct Charges – Closing Inventory
Operating Expenses = Employee Benefits Expense + Depreciation Expense + Other Expense
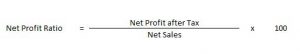
Profitability Ratios – Net Profit Ratio
This ratio establishes a relationship between Net profit and revenue from Operations i.e. Net Sales.
Profitability Ratios – Operating Profit Ratio
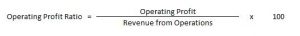
Operating Profit = Gross Profit – Other Operating Expenses + Other Operating Incomes
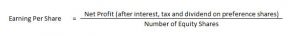
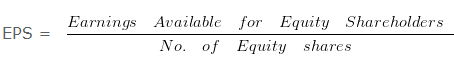
Profitability Ratios – Earning Per Share
Earning per share helps in calculating the profitability of the company.
Return on Investment (ROI) or Return on Capital Employed (ROCE):
It signifies how much return is generated by using the assets of an enterprise. Capital employed implies the funds invested in the business for the long term like share capital, debentures, and long-term loans. Then again, capital employed might be calculated by taking the aggregate of the assets side, i.e., non-current assets and working capital.
Along these lines, it is computed as follows:
Return on Investment (or Capital Employed) = (Profit before Interest and Tax)/(Capital Employed × 100)
Return on Shareholders’ Funds:
Shareholders are interested in knowing whether the investment made by them in the company is generating returns or not.
Also, only generation of returns is not sufficient, it is supposed to be higher than the return on investment else it would suggest that the organization’s assets have not been utilized gainfully.
Return on Shareholders’ Fund = (Profit after Tax/Shareholders’ Funds) x 100
Book Value per Share:
To calculate the value of shares as per the books, this ratio is used.
Book Value per share = Equity shareholders’ funds/Number of Equity Shares
Equity shareholder fund can be calculated as Shareholders’ Funds – Preference Share Capital. This ratio signifies the value of shareholders’ holding in the company and its effect on the market prices.
Dividend Payout Ratio:
This refers to the proportion of earnings that are distributed to the owners of the company, i.e., the shareholders. It is determined as:
Dividend Payout Ratio = Dividend per share/Earnings per share
Price / Earnings Ratio:
The ratio is computed as –
P/E Ratio = Market Price of a share/Earnings per share
It evaluates the growth of the company with respect to the industry it is a part of. It highlights the expectations of the investors and the movement of share price in the stock market.
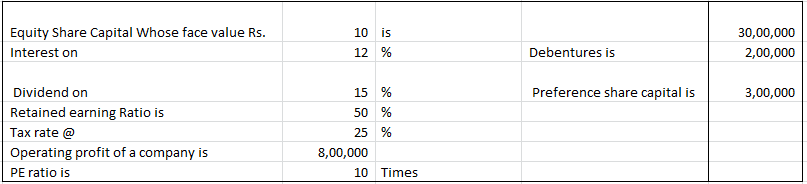
Calculation of Earning Per Share
Profitability Ratios – Questions 1: –
On the basis of the following data calculate earning per share
Explanation: –
EBIT = 800000
Less: Interest on Debentures = 200000
EBT = 600000
Less: Tax = 150000
EAT = 450000
Less: Preference Dividend = 300000
Earnings for Equity Shareholders = 150000
Less: Retained Earnings = 75000
Dividend Paid = 75000
= 150000/300000
= 0.5 Per share
Gross Profit Ratio, Operating Ratio & Operating Profit Ratio
Profitability Ratios – Question 2: –
The following information is given
If Revenue from Operations of XYZ Ltd is Rs. 1000000 Cost of Revenue from Operations is Rs. 450000 Selling Expense is Rs. 80000 Administrative Expenses is Rs. 60000
Calculate- Gross Profit Ratio ,Operating Ratio , Operating Profit Ratio
Explanation : –
Gross Profit Ratio= 550000/1000000 x 100 = 55%
Operating Ratio = 590000/1000000 x 100
Operating Ratio = 59 %
= 100 (-) Operating Ratio
= 100 (-) 59
Operating Profit Ratio = 41 %
Working Notes:
Gross Profit = Revenue from Operations (-) Cost of Revenue from Operations
Gross Profit = 1000000 (-) 450000
Gross Profit = 550000
Operating Cost = Cost of Revenue from Operations + Selling Expenses + Administrative Expenses
Operating Cost = 450000 + 80000 + 60000
Operating Cost = 590000