| Topic | Production Possibility Curve in Economics (PPC) |
| Subject | Microeconomics |
| Category | CBSE Class 11 Notes |
Production Possibility Curve
Due to scarcity of resources, the society cannot satisfy all its wants. In an economy, even if all the resources are used in the best possible manner, the capabilities of the economy are restricted due to scarcity of resources. Thus, the society has to decide what to produce out of an almost infinite range of possibilities. This is where the concept of Production Possibility Curve (PPC) comes into the picture.
What is Production Possibility Curve (PPC)?
Production Possibility Curve (PPC) is the graphical representation of the possible combinations of two goods that can be produced with given resources and level of technology. Since the choice is to be made between infinite possibilities, economists assume that there are only two goods being produced. The PPC is the locus of various possible combinations of two goods that can be produced with given resources and technology. The Production Possibility Curve is also known as the Production Possibility Frontier, Production Possibility Boundary, Transformation Curve, Transformation Frontier or Transformation Boundary.
Assumptions for Production Possibility Curve (PPC)
The concept of Production Possibility Curve is based on the following assumptions –
- The amount of resources in an economy is fixed. Although, theses resources can be transferred from one use to another.
- Using the given resources only 2 goods can be produced.
- These resources are fully and efficiently utilized.
- Resources are not equally efficient in the production of both goods. Therefore, when resources are transferred from one product to another, their productivity or efficiency in production decreases.
- The level of technology is constant.
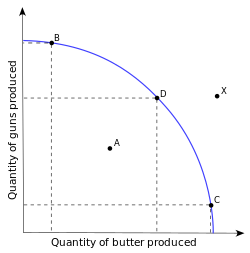
Let us consider an economy where two goods, good X and good Y are produced is produced. The production Possibility Curve is given below for such a situation.
With the given resources, many combinations of the two goods can be produced in the economy. If XA amount of Good X, it will be possible to produce only YA amount of Good Y. Similarly for XB amount of Good X, only YB amount of Good Y can be produced.
This means that more of one good can be produced by sacrificing the other. To produce one more unit of Good X, less of Good Y can be produced. When all these points of different combinations of production of the two goods are joined, they form a Production Possibility Curve.
Operation of the Economy on the PPC
The PPC shows the maximum available possibilities which an economy can produce. The point on the PPC where the economy operates depends on how well the resources are utilised. If the resources are fully utilised the economy may operate on any point on the PPC according to the amount of each goods produced. This is shown by points A and B in the diagram given above. If the resources are not utilised fully and efficiently, the economy will operate inside the PPC. This is shown by point C in the diagram. Both of these situations are attainable combinations. On the other hand, the economy cannot operate at any point outside the PPC as, with the given amount of resources, it is impossible for the economy to produce any combination more than the given possible combinations. This is shown by point D in the diagram given above. Such situations are known as unattainable combinations.
Marginal Rate of Transformation (MRT)
Marginal Rate of Transformation (MRT) is the ratio of the number of units of a commodity sacrificed to gain an additional unit of another commodity.
MRT = ΔUnits Sacrificed/Δ Units Gained
Consider the given economy, where only guns and butter are produced,
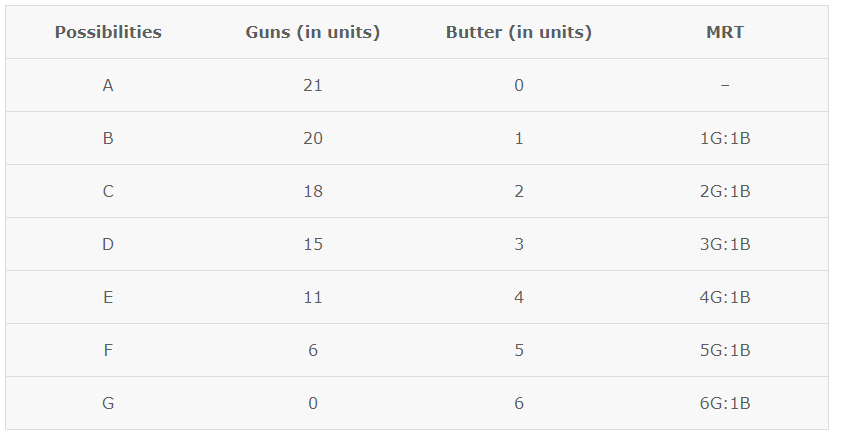
In the given example, 20 units of guns and 1 unit of butter can be produced by utilizing the resources fully and efficiently. If the economy decides to produce 2 units of butter, then it would have to cut down on the production of guns by 2 units.
Characteristics of Production Possibility Curve (PPC)
- PPC slopes downward – PPC shows all the maximum possible combinations of two goods which can be produced with the available resources and technology. Therefore, more of one good can be produced only by taking resources from away from the production of another good.There exists an inverse relationship between the change in quantity of one commodity and the change in the quantity of another commodity. Therefore, PPC slopes downward from left to right.
- PPC is concave shaped – PPC is concave shaped because more and more units of one commodity are sacrificed to gain an additional unit of another commodity i.e. Marginal Rate of Transformation (MRT). This is because no resource is equally efficient in the production of all goods.
Multiple choice questions
- The society has to decide what to produce out of an almost infinite range of possibilities due to : –
- Scarcity of resources
- Abundance of resources
- Non availability of resources
- All of the above
- A PPC Curve is : –
- Sloping downwards
- Sloping upwards
- Concave Shaped
- Both A and C
- PPC is concave shaped because more and more units of one commodity are ———- to gain an additional unit of another commodity.
- Marginal Rate of …….. is the ratio of the number of units of a commodity ——- to gain an additional unit of another commodity.
Solutions
- 1
- 4.
- Sacrificed
- Transformation, sacrificed