Classification of Ratios : Accounting ratios are used to analyse the financial position of the firm. They are being categorised into different types which are given as below:
- Balance Sheet Ratios
- Statement of Profit & Loss Ratios
- Composite Ratios
However, from the users point of view, they are interested to know about the liquidity, solvency, turnover and profitability of the organisation. So, the main categories of ratio from financial users perspective are:
Liquidity Ratios : Liquidity means the firms ability to meet its current liabilities. In other words, the ability of a business to pay its short-term debts is frequently referred to as liquidity position of the business. Short term creditors of the firm are generally interested to know about the liquidity position of the firm. The liquidity ratio is further categorised into two parts: (i) Current Ratio & (ii) Liquid Ratio
a. Current Ratio : It shows the relationship between current assets and current liabilities. It is also known as working capital ratio. The ideal current ratio is 2:1. The term current assets means the assets which are easily convertible into cash or cash equivalents within 12 months & the term current liabilities means the liabilities which are payable within a period of 12 months.

b. Liquid Ratio : It shows the relationship between liquid assets and current liabilities. It is also known as acid test ratio or quick ratio. The ideal liquid ratio is 1:1. The term liquid assets means the assets which are easily convertible into cash or cash equivalents very shortly. All current assets except inventories and prepaid expenses are included in liquid assets.

Computation of current ratio
Classification of Ratios : Example 1
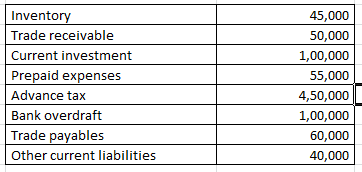
On the basis of the following information calculate the current ratio:
Explanation : –

Current ratio = 700000/200000
Current ratio = 3.5 :1
Working note 1 : Current assets = Inventory + Trade receivable + Current investment + Prepaid expenses + Advance tax
Current assets = 45000 + 50000 + 100000 + 55000 + 450000
Current assets = 700000
Working note 2 : Current liabilities = Bank overdraft + Trade payables + Other current liabilities
Current liabilities = 100000 + 60000 + 40000
200000
Computation of liquidity ratio
Classification of Ratios : Example 2
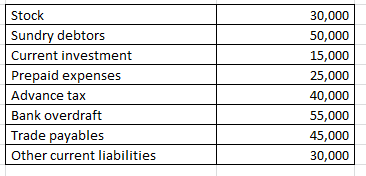
On the basis of the following information calculate the liquidity ratio:
Explanation : –
![]()
Liquidity ratio = 65000/130000
Liquidity ratio = 0.5 :1
Working note 1 : Liquid assets = Current assets (-) ( Stock + Prepaid expenses + Advance tax )
Liquid assets = 160000 (-) 30000 + 25000 + 40000
Liquid assets = 65000
Working note 2 : Current assets = Stock + Sundry debtors + Current investment + Prepaid expenses + Advance tax
Current assets = 30000 + 50000 + 15000 + 25000 + 40000
Current assets = 160000
Working note 3 : Current liabilities = Bank overdraft + Trade payables + Other current liabilities
Current liabilities = 55000 + 45000 + 30000
130000
Computation of quick ratio
Classification of Ratios : Example 3
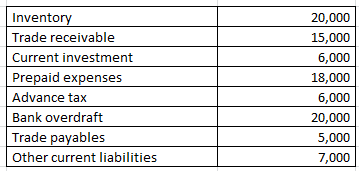
On the basis of the following information calculate the Quick ratio:
Explanation : –

Quick ratio = 21000/12000
Quick ratio = 1.75 :1
Working note 1 : Liquid assets = Current assets (-) ( Inventory + Prepaid expenses + Advance tax )
Liquid assets = 65000 (-) 20000 + 18000 + 6000
Liquid assets = 21000
Working note 2 : Quick liabilities = Current liabilities (-) Bank overdraft
Quick liabilities 32000 (-) 20000
Quick liabilities 12000
Working note 3 : Current assets = Inventory + Trade receivable + Current investment + Prepaid expenses + Advance tax
Current assets = 20000 + 15000 + 6000 + 18000 + 6000
Current assets = 65000
Working note 4 : Current liabilities = Bank overdraft + Trade payables + Other current liabilities
Current liabilities = 20000 + 5000 + 7000
32000
when current liabilities are given
Classification of Ratios : Example 4
From the following information compute the current ratio.

Explanation : –

Current Ratio = 1300000/400000
Current Ratio = 3.25 :1
Workings:
Working Capital = Current assets (-) current liabilities
900000 = Current assets (-) 400000
Current assets = 1300000
Workings:
current liabilities = Trade Payables (+) Other Current Liabilities
current liabilities = 225000 (+) 175000
current liabilities = 400000
Determination of working capital
Classification of Ratios : Example 5
From the following given information:
A firm had current assets of RS. 140000
it then paid a current liability of RS. 20000
After this payment the current ratio was 3 : 2
Determine the current liabilities and working capital after the payment.
Explanation : –
Working capital = Current assets (-) Current liabilities
= 120000 (-) 80000
= 40000
Workings:
Current Assets = 140000
Current Assets After the payment of RS. 20000 would be 140000 (-) 20000 = 120000
As current ratio is 3 : 2 and current assets are RS. 120000

3/2 = 120000/Current liabilities
Current liabilities = 240000/3
Current liabilities = 80000
Determination of working capital when current ratio given
Classification of Ratios : Example 6
From the following information:
A firm had current assets of RS. 225000
it then paid a current liability of RS. 45000
After this payment the current ratio was 9 : 7
Determine the current liabilities and working capital Before the payment.
Explanation : –
(i) Working capital = Current assets (-) Current liabilities
= 180000 (-) 140000
= 40000
Workings:
Current Assets = 225000
Current Assets After the payment of RS. 45000 would be 225000 (-) 45000 = 180000
As current ratio is 9 : 7 and current assets are RS. 180000

9/7 = 180000/Current liabilities
Current liabilities = 1260000/9
Current liabilities = 140000
Before the payment of liabilities of RS. 45000 total amount of
Current liabilities = 45000 + 140000
Current liabilities = 185000
Working capital = 40000
Liquid ratio on the basis of working capital
Classification of Ratios : Example 7
Current Assets = Rs. 80000 . Inventory = Rs. 15000 . Prepaid Expenses = Rs. 50000 . Working Capital = Rs. 50000 Calculate Liquid Ratio.
Explanation : –
Liquid Assets = Current Assets (-) Inventory (-) Prepaid Expenses
Liquid Assets = 80000 (-) 15000 (-) 50000
Liquid Assets = 15000
Current Liabilities = 30000

Liquid Ratio = 15000/30000
Liquid Ratio = 0.5
Working Note 1 :
Current Liabilities = Current Assets (-) Working Capital
= 80000 (-) 50000
= 30000
Calculation of Liquid Ratio
Classification of Ratios : Example 8
Current Assets of ABC Ltd. are Rs. 72000 and the current ratio is 1.2 . Value of inventories is Rs. 27000 . Calculate liquid ratio.
Explanation : –

OR

Current Liabilities = 72000/1.2
Current Liabilities = 60000

Quick Ratio = 45000/60000
Quick Ratio = 0.75
Working Notes:
Liquid Assets = Current Assets (-) Inventory
Liquid Assets = 72000 (-) 27000
Liquid Assets = 45000
Current Ratio on the basis of Quick Ratio
Classification of Ratios : Example 9
Value of Inventory of HRD & Co. is Rs. 240000 . Liquid Assets are Rs. 120000
Quick Ratio is 0.5 . Calculate the current ratio .
Explanation : –

OR

Current Liabilities = 120000/0.5
Current Liabilities = 240000

Current Ratio = 360000/240000
Current Ratio = 1.5 :1
Working Notes:
Current Assets = Liquid Assets + Inventory
= 120000 + 240000
= 360000
Solvency Ratio Analysis
Solvency Ratio Analysis : It measure the ability of a business to survive for a long period of time. These ratios are very important for stockholders and creditors as these ratios assess the ability of the firm to meet its long term liabilities.
The solvency ratios are categorised into following types :
a) Debt Equity Ratio
b) Total Assets to Debt Ratio
c) Proprietary Ratio
d) Interest Coverage Ratio
Debt Equity Ratio
It explains the relationship between long term debts and shareholder’s funds. The debt-equity ratio of 2:1 is considered as ideal.

Here, Debt includes Long-term Borrowings and Long-term Provisions. Shareholder’s Funds include Share Capital and Reserve & Surplus.
Total Assets to Debt Ratio
This ratio is a variation of debt-equity ratio. In this ratio, assets are expressed in terms of long term debts.

Here, Total Assets = Non- Current Assets + Non-Current Investments + Long Term Loans & Advances + Current Assets
Debts = Long-term Borrowings and Long-term Provisions
Proprietary Ratio
It is the proportion of total assets funded by the shareholders. A higher proprietary ratio is an indicator of sound financial position from long-term point of view.

Interest Coverage Ratio
The interest coverage ratio is a debt ratio and profitability ratio used to determine how easily a company can pay interest on its outstanding debt. This ratio indicates how many times the interest charges are covered by the profits available to pay interest charges.

How to compute debt equity ratio – Solvency Ratio Analysis – Question 1
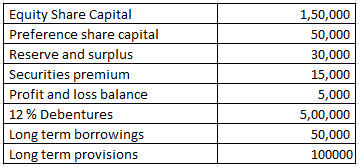
From the following information calculate the debt equity ratio.
Explanation : –

= 650000/250000
= 2.6 : 1
Working note 1 : Long term Debt = 12 % Debentures + Long term borrowings + Long term provisions
Long term Debt = 500000 + 50000 + 100000
Long term Debt = 650000
Working note 2 : Shareholders fund = Equity Share Capital + Preference share capital + Reserve and surplus + Securities premium + Profit and loss balance
Shareholders fund = 150000 + 50000 + 30000 + 15000 + 5000
Shareholders fund = 250000
When total debts are given – Solvency Ratio Analysis – Question 2
From the following information compute the current ratio.

Explanation : –

Current Ratio = 35000/20000
Current Ratio = 1.75 :1
Workings:
Working Capital = Current assets (-) Current liabilities
15000 = Current assets (-) 20000
Current assets = 35000
Workings:
Current liabilities = Total debt (-) Long term debt
Current liabilities = 40000 (-) 20000
Current liabilities = 20000
How to compute debt equity ratio – Solvency Ratio Analysis – Question 3
From the following information calculate debt equity ratio.
Explanation : –

Debt equity ratio = 200000/400000
Debt equity ratio = 0.5 : 1
Working note 1 : Long term Debt = Long term borrowings + Long term provisions
Long term Debt = 120000 + 80000
Long term Debt = 200000
Working note 2 : Shareholders fund = Non current assets + Working capital (-) Non current liabilities
OR
Shareholders fund = Non current assets + Current assets (-) Current liabilities (-) Long term borrowings (-) Long term provisions
Shareholders fund = 500000 + 200000 (-) 100000 (-) 120000 (-) 80000
Shareholders fund = 400000
Calculation of Equity ratio – Solvency Ratio Analysis – Question 4
From the Following information calculate Equity Ratio
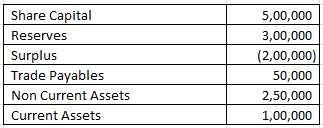
Explanation : –

Equity Ratio = 600000/300000
Equity Ratio = 2
Working note 1 :
Shareholders’ Equity = Share Capital + Reserves + Surplus
= 500000 + 300000 + -200000
= 600000
Capital employed = Non Current Assets + Current Assets (-) Trade Payables
Capital employed = 250000 + 100000 (-) 50000
Capital employed = 300000
Calculation of Proprietary Ratio – Solvency Ratio Analysis – Question 5
Compute Proprietary ratio if equity share capital is Rs. 125000 ,Preference Share Capital is Rs. 100000 ,Capital Reserve is Rs. 80000 ,Profit & Loss Balance is Rs. 55000 . The value of 7 % Debentures is Rs. 62500 and 9 % Mortgage loan- Rs. 112500 .Value of Current Liabilities
is Rs. 262500 Non Current Assets is worth Rs. 275000 Value of Current Assets is Rs. 125000 .
Explanation : –

Proprietary Ratio = 360000/400000
Proprietary Ratio = 0.9
Working note 1 : Shareholders’ Funds = Equity share capital + Preference share capital + Capital reserve + Profit and loss balance
Shareholders’ Funds = 125000 + 100000 + 80000 + 55000 Shareholders’ Funds = 360000
Working note 2 : Total Assets = Non current assets + Current assets
Total Assets = 275000 + 125000
Total Assets = 400000
Debt to total assets ratio – Solvency Ratio Analysis – Question 6

Compute Debt to Total Assets Ratio from the above information.
Explanation : –

Debt to Total Assets Ratio = 250000/125000
Debt to Total Assets Ratio = 2 :1
Working note 1 :
Total Assets = Fixed Assets + Non Current Investments + Current Assets
= 80000 + 20000 + 25000
Total Assets = 125000
Interest Coverage Ratio – Solvency Ratio Analysis – Question 7
Compute Interest Coverage ratio if equity share capital is Rs. 1200000 ,Preference Share Capital is Rs. 720000 ,Capital Reserve is Rs. 360000 ,Profit & Loss Balance is Rs. 600000 . The Value of 13 % debentures is Rs. 250000 and 11 % Mortgage loan of Rs. 300000 .The value of Current Liabilities is Rs. 1180000 Non Current Assets is worth Rs. 2400000 Value of Current Assets is Rs. 3000000 .
Explanation : –

Interest Coverage Ratio = 589500/65500
Interest Coverage Ratio = 9 times
Working Notes:
Interest on debenture = 13% x 250000
= 32500
Interest on loan = 11% x 300000
33000
Total interest charges = 6550
Interest Coverage Ratio & Debt Service Coverage Ratio – Question 8
Calculate- Interest Coverage Ratio & Debt Service Coverage Ratio from the following information. Net Profit before interest and tax is Rs. 300000 . 5 % Long Term Debt 500000 (Principle amount is repayable in 10 equal installments) .
Explanation : –

= 300000/25000
= 12 times

Debt Service Coverage Ratio = 300000/(25000+50000)
Debt Service Coverage Ratio = 300000/75000
Debt Service Coverage Ratio = 4 times
Working Notes:
1. Interest on Long Term Debt = 5 % x 500000
25000
Activity Ratio Analysis
Activity Ratio Analysis – Activity ratios are financial analysis tools used to measure a business’ ability to convert its assets into cash. These ratios are known as turnover ratios because they indicate the rapidity with which the resources available to the concern are being used to produce revenue from operations.
The different types of activity ratios are:
- Inventory Turnover Ratio
- Trade Receivables Turnover Ratio
- Trade Payables Turnover Ratio
- Working Capital Turnover Ratio
Inventory Turnover Ratio
It indicates the relationship between the cost of revenue from operations during the year and average inventory during the year.

Here, Cost of Revenue from Operations = Opening Inventory + Purchases + Carriage Inward + Wages + Other Direct Charges – Closing Inventory
Trade Payables Turnover Ratio
It indicates the relationship between credit purchases and average trade payables during the year.

Trade Payables include Creditors and Bills Payables.
Trade Receivables Turnover Ratio
It indicates the relationship between credit revenue from operations and average trade receivables during the year.

Working Capital Turnover Ratio
This ratio is important in non-manufacturing concerns where current assets play a major role in generating sales. It indicates the efficient use of working capital.
Calculation of current assets turnover ratio – Classification of Ratios – Question 1
From the following information calculate the Current assets turnover ratio:
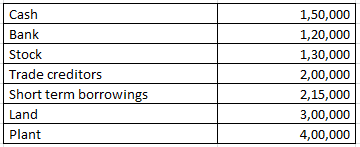
Revenue from the operation for the year were RS. 2800000
Explanation : –

Current assets turnover ratio = 2800000/400000
Current assets turnover ratio = 7 Times
Working note 1 : Current assets = Cash + Bank + Stock
Current assets = 150000 + 120000 + 130000
Current assets = 400000
Calculation of inventories when Inventory Ratio is given – Classification of Ratios – Question 2
Calculate the value of opening Inventory from the following information.
Cost of revenue from operations is 1200000 and Inventory turnover ratio is 3 Times. and opening inventory is 40000 less than the closing inventory
Explanation : –

3 = 1200000/Average inventory
Average inventory = 400000
Workings:
Opening inventory = 400000 (-)40000/2
Opening inventory 380000
Closing inventory = 400000 (+)40000/2
Closing inventory = 420000
Activity Ratio Analysis – Classification of Ratios – Question 3
Calculate the value of opening Inventory from the following information:
Cost of revenue from operations is 16000 and Inventory turnover ratio is 1 Times. and opening inventory is 6 Times More than the closing inventory.
Explanation : –

1 = 16000/Average inventory
Average inventory = 16000
Workings:

32000 = Opening inventory + Closing inventory
Since the opening inventory is 6 Times More than the closing inventory therefore the ratio between opening inventory and closing inventory will be 7 : 1
Opening inventory = 32000 x 7/8
Opening inventory = 28000
Closing inventory = 32000 x 1/8
Closing inventory = 4000
When inventory and current assets given – Classification of Ratios – Question 4
From the following information compute the current ratio.

Explanation : –

Current Ratio = 900000/300000
Current Ratio = 3 :1
Workings:
Working Capital = Current assets (-) Current liabilities
600000 = 900000 (-) Current liabilities
Current liabilities = 300000
Fixed assets turnover ratio – Classification of Ratios – Question 5
From the following information, calculate fixed assets turnover ratio:
Revenue from the operation for the year were RS. 2000000
Explanation : –

Fixed assets turnover ratio = 2000000/500000
Fixed assets turnover ratio = 4 Times
Total Fixed assets = Land + Building + Furniture
Total Fixed assets = 300000 + 50000 + 150000
Total Fixed assets = 500000
Inventory turnover ratio and average age of inventory – Classification of Ratios – Question 6
Calculate Inventory turnover ratio and average age of inventory from the following information:
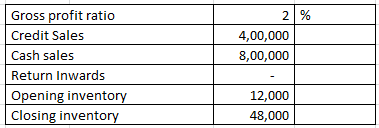
Explanation : –

Inventory turnover ratio = 1176000/30000
Inventory turnover ratio = 39.2 Times

Average age of inventory = 360/39.2
= 9.18 Days
Workings:
Cost of goods sold = Net Sales (-) gross profit
1200000 (-) 2% X 1200000
1200000 (-) 24000
1176000
Net sales = Cash sales + Credit Sales (-) Return Inwards
800000 + 400000 (-) 0
1200000

= 30000
Inventory turnover ratio when closing stock is given – Classification of Ratios – Question 7
Calculate Inventory turnover ratio from the following information:

Explanation : –

Inventory turn over ratio = 600000/240000
= 2.5 Times
Workings:
Cost of goods sold = Net Sales (-) gross profit
= 2000000 (-) 70% x 2000000
= 2000000 (-) 1400000
= 600000
Net sales = Cash sales + Credit Sales
500000 + 1500000
2000000

Average inventory = 240000
Cost of goods sold = Opening inventory + Purchases (-) Closing inventory
600000 = Opening inventory + 840000 (-) 360000
= Opening inventory + 480000
Opening inventory = 120000
Inventory turnover ratio when GP ratio based on cost – Classification of Ratios – Question 8
Calculate Inventory turn over ratio from the following information: Gross profit ratio is 10 % Of cost and revenue from operation is RS. 770000 . Opening inventory was 9/11 of closing inventory and closing inventory was 10 % of revenue from operation.
Explanation : –

Inventory turnover ratio = 700000/70000
Inventory turnover ratio = 10 Times
Working note: = Gross profit ratio is 10% Of cost
Therefore goods costing Rs. = 100 is sold for RS. 110
Cost of goods sold = 100
If revenue from operation is = 770000
Cost of goods sold = 700000 ( 770000 X 100/110 )

= 70000
Closing inventory = 10% x Revenue from operation
Closing inventory = 10% x 770000
Closing inventory = 77000
Opening inventory = 9/11 x Closing inventory
Opening inventory = 9/11 x 77000
Opening inventory = 63000
Inventory turnover ratio when GP ratio is negative – Classification of Ratios – Question 9
Calculate Inventory turnover ratio from the following information:

Explanation : –

Inventory turnover ratio = 525000/37500
Inventory turnover ratio = 14 Times
Workings:
Cost of goods sold = Revenue from operation (-) gross profit
= 500000 (-) -5% X 500000
= 500000 (-) -25000
= 525000

= 37500
Inventory turnover ratio when opening stock is given – Classification of Ratios – Question 10
Calculate Inventory turn over ratio from the following information:

Explanation : –

Inventory turn over ratio = 280000/80000
Inventory turn over ratio = 3.5 Times
Workings:
Cost of goods sold = Opening inventory + Purchases + Direct expenses – Closing inventory
280000 = 40000 + 300000 + 60000 – Closing inventory
Closing inventory = 120000

Average inventory = 80000
Total assets turnover ratio – Classification of Ratios – Question 11
From the following information calculate the total assets turnover ratio.
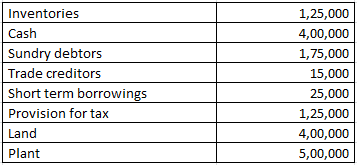
Revenue from the operation for the year were RS. 4800000
Explanation : –

Total assets turnover ratio = 4800000/1600000
Total assets turnover ratio = 3 Times
Working note 1 : Total assets = Inventories + Cash + Sundry debtors + Land + Plant
Total assets = 125000 + 400000 + 175000 + 400000 + 500000
Total assets = 1600000
Working capital turnover ratio – Classification of Ratios – Question 12
From the following information calculate the working capital turnover ratio:
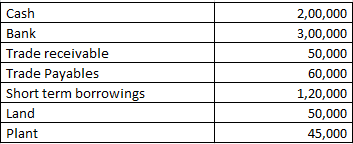
Revenue from the operation for the year were RS. 1850000
Explanation : –

Working capital turnover ratio = 1850000/370000
Working capital turnover ratio = 5 Times
Working note 1 : Working capital = Current assets (-) Current liabilities
Working capital = 550000 (-) 180000
Working capital = 370000
Working note 2 : Current assets = Cash + Bank + Trade receivable
Current assets = 200000 + 300000 + 50000
Current assets = 550000
Working note 3 : Current liabilities = Trade Payables + Short term borrowings
Current liabilities = 60000 + 120000
Current liabilities = 180000
Determination of current assets when current ratio is given – Question 13
Current Ratio of a business is 13 : 11 and Quick Ratio is 0.75 .
If Working Capital is Rs. 200000 then calculate the value of current assets and inventory.
Explanation : –
Working Capital = Current Assets (-) Current Liabilities
or
Current Liabilities = Current Assets (-) Working Capital
= 1300000 (-) 200000
= 1100000

or
Liquid Assets = Current Liabilities x Quick Ratio
= 1100000 x 0.75
= 825000
Inventory = Current Assets (-) Liquid Assets
= 1300000 (-) 825000
= 475000
Working Note 1 :
Working Capital = Current Assets (-) Current Liabilities
Working Capital = 13 (-) 11
Working Capital = 2
When working capital = 2 then Current Assets = 13
When working capital = 200000 then Current Assets = 1300000
Trade payable turnover ratio – Classification of Ratios – Question 14
Calculate the trade payable turnover ratio and average payment period From the following information. Credit purchases during the 2016-2017 is 1000000 . Balance of opening Creditors and Bills payable on 01.04.2016 is RS. 40000 and 15000 and the Balance of Closing Creditors and bills payable on 31.03.2017 is RS. 35000 and 10000
Explanation : –

Trade Payable Turnover Ratio = 1000000/50000
Trade Payable Turnover Ratio = 20 Times

Average Payment period = 360/20
Average Payment period = 18 Days
Workings:

Average trade Payables = 100000/2
Average trade Payables = 50000
Trade receivable turnover ratio – Classification of Ratios – Question 15
Calculate the Trade receivable Turnover Ratio and average collection period from the following information: Total revenue from the operation is 100000 and cash revenue is 10 % of total revenue from the operation. Balance of opening receivable on 01.04.2016 is RS. 60000 and the Balance of Closing receivable on 31.03.2017 is 40000
Explanation : –

Trade receivable Turnover Ratio = 90000/50000
Trade receivable Turnover Ratio = 1.8 Times

Average Collection period = 360/1.8
Average Collection period = 200 Days
Workings:
Credit sales = 100000 x 0.9
= 90000

Average trade receivables 50000
Profitability Ratios
It is also known as income ratio. The objective of every organisation is to earn profit and hence the organisations would definitely want to keep a track on various aspects of profit like operating profit, net profit etc. Therefore, they prepare and compute the profitability ratios.
The different types of profitability ratios are:
- Gross Profit Ratio
- Operating Ratio
- Net Profit Ratio
- Operating Profit Ratio
- Earning Per Share
Gross Profit Ratio
This ratio establishes a relationship between Gross profit and revenue from Operations i.e. Net Sales.

Gross Profit = Revenue from Operations – Cost of Revenue from Operations
Cost of Revenue from Operations = Opening Inventory + Purchases + Carriage Inward + Wages + Other Direct Charges – Closing Inventory
Operating Ratio
This ratio compares an enterprise’s cost of revenue from operations and operating expenses to its revenue from operations.

Cost of Revenue from Operations = Opening Inventory + Purchases + Carriage Inward + Wages + Other Direct Charges – Closing Inventory
Operating Expenses = Employee Benefit Expense + Depreciation Expense + Other Expense
Net Profit Ratio
This ratio establishes a relationship between Net profit and revenue from Operations i.e. Net Sales.

Operating Profit Ratio

Operating Profit = Gross Profit – Other Operating Expenses + Other Operating Incomes
Earning Per Share
Earning per share helps in calculating the profitability of the company.

Calculation of Earning Per Share
Profitability Ratios – Questions 1 : –
On the basis of the following data calculate earning per share

Explanation: –
EBIT = 800000
Less: Interest on Debentures = 200000
EBT = 600000
Less: Tax = 150000
EAT = 450000
Less: Preference Dividend = 300000
Earnings for Equity Shareholders = 150000
Less: Retained Earnings = 75000
Dividend Paid = 75000

= 150000/300000
= 0.5 Per share
Gross Profit Ratio, Operating Ratio & Operating Profit Ratio
Profitability Ratios – Question 2 : –
The following information is given
If Revenue from Operations of XYZ Ltd is Rs. 1000000 Cost of Revenue from Operations is Rs. 450000 Selling Expense is Rs. 80000 Administrative Expenses is Rs. 60000
Calculate- Gross Profit Ratio ,Operating Ratio , Operating Profit Ratio
Explanation : –

Gross Profit Ratio= 550000/1000000 x 100 = 55%

Operating Ratio = 590000/1000000 x 100
Operating Ratio = 59 %
= 100 (-) Operating Ratio
= 100 (-) 59
Operating Profit Ratio = 41 %
Working Notes:
Gross Profit = Revenue from Operations (-) Cost of Revenue from Operations
Gross Profit = 1000000 (-) 450000
Gross Profit = 550000
Operating Cost = Cost of Revenue from Operations + Selling Expenses + Administrative Expenses
Operating Cost = 450000 + 80000 + 60000
Operating Cost = 590000
